Your business data is already telling you how to grow - here's how to use it
Business systems quietly collect information every minute of every day. Sales transactions, website visits, customer interactions, operational timings - it's all there, accumulating in databases and spreadsheets. But most SMEs barely scratch the surface of what this data could tell them.
The information's right there, ready to guide better decisions, spot problems early, and show you opportunities you'd otherwise miss. You just need to know how to access it in a way that actually helps.
We're not talking about expensive data scientists or complex analytics platforms. Modern business intelligence tools - particularly Microsoft Power BI - can transform the information you're already collecting into clear, actionable insights.
This article walks through what data you're probably sitting on, why traditional reporting falls short, and how UK businesses are using their existing information to make smarter decisions every day.
The data you're already collecting (but probably ignoring)
Think about what goes through your systems on a daily basis, it could be something like:
Transaction patterns
Every sale creates a data point. Not just the amount, but when it happened, what was bought together, how it was paid for, whether it's a repeat customer. These patterns can reveal which products truly bring in profit, when customers are most likely to buy, and what combinations sell well together.
Customer behaviour trails
From first website visit to support ticket, customers leave digital footprints. How they find you, what they look at, what they abandon, when they contact support - each interaction tells part of a story about what works and what doesn't in your business.
Operational timings
How long things take matters. Order processing times, delivery speeds, response times to enquiries, time between repeat purchases - these metrics often hold the key to competitive advantage. Small improvements compound into significant efficiency gains.
Financial rhythms
Beyond basic profit and loss, your financial data contains patterns. When do customers actually pay? Which products tie up cash in inventory? What's the real cost of acquiring different types of customers? The answers influence everything from cash flow to pricing strategy.
Why spreadsheet reports aren't enough anymore
"We already have reports!" Yes, but if those reports are static spreadsheets emailed monthly, you're missing the real value of your data. Here's why traditional reporting falls short:
Historical snapshots don't drive decisions
By the time that monthly report lands in your inbox, the information is already old. Modern business moves too fast for rear-view mirror management. You need insights you can act on today, not a summary of what happened last month.
Averages hide the interesting bits
Your average order value might be —50, but that tells you nothing about the customers spending —500 or those buying single items. The opportunities and problems live in the patterns and outliers, not the averages.
Static reports can't answer follow-up questions
Spot something interesting in a report? Want to dig deeper? With traditional reporting, you're stuck waiting for IT or your analyst to run another query. By then, the moment for action might have passed.
The journey from data to insights to action
Our team have expert knowledge in Microsoft Power BI. Here's what we've learned from helping UK businesses unlock their data value:
Stage 1: Visibility
Most businesses start just wanting to see what's happening. A simple dashboard showing key metrics in real-time often delivers immediate value. One of our clients, a renewable energy company, began with a basic Power BI dashboard to track consumption patterns. Just being able to see their data clearly helped them spot inefficiencies they'd never noticed.
Stage 2: Understanding
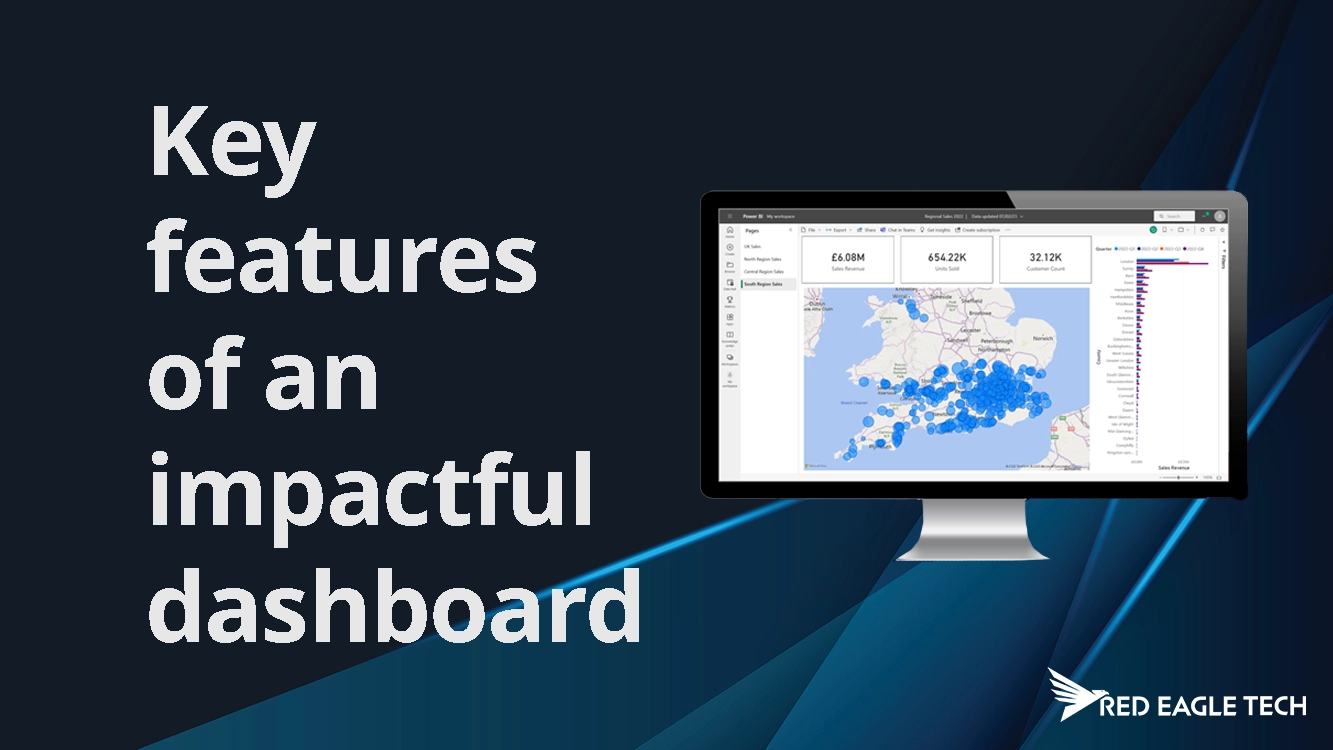
Once you can see your data, you start asking why. Why do sales dip on Wednesdays? Why do some customers never return? This is where interactive dashboards become powerful - letting you filter, drill down, and explore your data to find answers.
Stage 3: Prediction
With enough historical data, patterns emerge that help predict future trends. Not crystal ball stuff - practical insights like seasonal patterns, growth trajectories, and early warning signs of problems.
Stage 4: Integration
This is where it gets interesting. Businesses may realise that they needed more than just dashboards. Perhaps you would like your customers to see personalised insights. Our team builds custom solutions with Power BI embedded in their own branded interface. Their customers can now track usage, compare periods, and get efficiency recommendations - all using data that was always there but never accessible.
Don't just take our word for it
Here's what some of our valued clients say:
Omer A. - London, GB
It has been a pleasure working with Red Eagle Tech once again - an exceptional service performed by Kat and the team.
Eamon H. - Glasgow, GB
Kat was amazing and I can't recommend highly enough. Understood a difficult brief perfectly and turned it around first time. Will definitely be ordering again!
Michael C. - Bolton, GB
Great work - fast and efficient. Would highly recommend.
Eamon H. - Manchester, GB
"Whomever came up with the attached!? - Genius! - they should be building cities not dashboards! It's ideal for the purpose."
Amira S. - Birmingham, GB
From the initial call to the delivery the process was brilliant. We are able to understand our business better thanks to Kat and the team!
Jacob T. - Leeds, GB
They make Power BI not only useful but exciting. I had no idea how much it could do and I genuinely didn't expect to enjoy a data project this much.
What business intelligence actually looks like for SMEs
Forget the corporate stereotype of wall-mounted screens and complex analytics teams. For most UK SMEs, practical business intelligence looks like:
Automated dashboards replacing manual reports
Instead of someone spending hours pulling together weekly reports, dashboards update automatically. Sales teams see performance without asking. Operations spot bottlenecks as they form. Management makes decisions based on current data.
Alerts for things that matter
Your data can tell you when something needs attention. Stock running low. Customer complaints trending up. Sales target at risk. Smart alerts mean you manage by exception instead of constantly checking.
Self-service insights
When managers can answer their own questions without calling IT, decisions happen faster. Modern BI tools are designed for business users, not data scientists. If you can use Excel, you can explore your business data.
Common data opportunities most businesses miss
Customer lifetime value
You know what a customer spends today, but what about over their entire relationship with you? Understanding lifetime value changes how you think about acquisition costs and customer service investments.
Process bottlenecks
Where does work actually get stuck? Data can reveal process problems that everyone works around but nobody talks about. Often, small changes to bottleneck areas deliver outsized improvements.
Hidden connections
Sometimes unrelated things connect in surprising ways. Weather affecting sales. Staff scheduling impacting customer satisfaction. Marketing campaigns influencing operations. Your data contains these connections - you just need to look.
Quality indicators
Before customers complain, data often shows quality declining. Return rates creeping up. Support tickets changing pattern. Delivery times extending. Early warning systems prevent problems becoming crises.
Getting started with your data goldmine
You don't need a massive project to start benefiting from your data:
Week 1: Audit what you have
List your business systems and what data they collect. Don't judge or plan yet - just document. You'll be surprised how much information you're already gathering.
Week 2: Identify quick wins
What questions do you regularly ask but struggle to answer? Which manual reports take longest to create? Where do you make decisions based on gut feel when data exists? These are your starting points.
Week 3: Start simple
Pick one area and improve visibility. Maybe it's a sales dashboard, operational metrics, or customer analytics. Start with standard tools - even Excel can create basic dashboards. The goal is momentum, not perfection.
Week 4: Build from success
Once people see what's possible, demand grows naturally. That's when you might consider Power BI for more sophisticated visualisations, or custom solutions for specific needs.
When standard tools aren't enough
Sometimes businesses discover their data needs go beyond standard dashboards.
- Your customers need to see certain data insights
- You need branded, integrated solutions
- Your workflows require custom functionality
- Industry-specific requirements demand tailored approaches
This is where custom development builds on your BI foundation. Not replacing tools like Power BI, but embedding them into larger solutions that serve your unique business needs.
The real value of your business data
Every day your data doesn't work for you is a day of missed opportunities. Not dramatic, company-saving revelations - just steady improvements that compound over time. Better decisions based on facts rather than feelings. Problems spotted before they grow. Opportunities identified while they're still opportunities.
The businesses thriving in today's economy aren't necessarily those with the most data. They're the ones using the data they have to make smarter decisions faster than their competition.
Your data is already there, waiting. The question isn't whether to use it, but how quickly you can start benefiting from insights you're currently missing.
Want to explore what insights might be hiding in your business data? Whether you need a simple Power BI dashboard or a complete custom analytics solution, we help UK businesses turn their data into competitive advantage. Let's have a straightforward chat about what's possible with the information you're already collecting.


