Module Overview

Getting started with Power BI
We'll start with a big-picture understanding of the Power BI offering, with a high-speed run through of the end-to-end workflow.
This covers importing data, creating reports and a dashboard, and sharing it with a colleague.
- Power BI ecosystem overview
- End-to-end workflow demonstration
- Basic report creation
- Sharing and collaboration basics
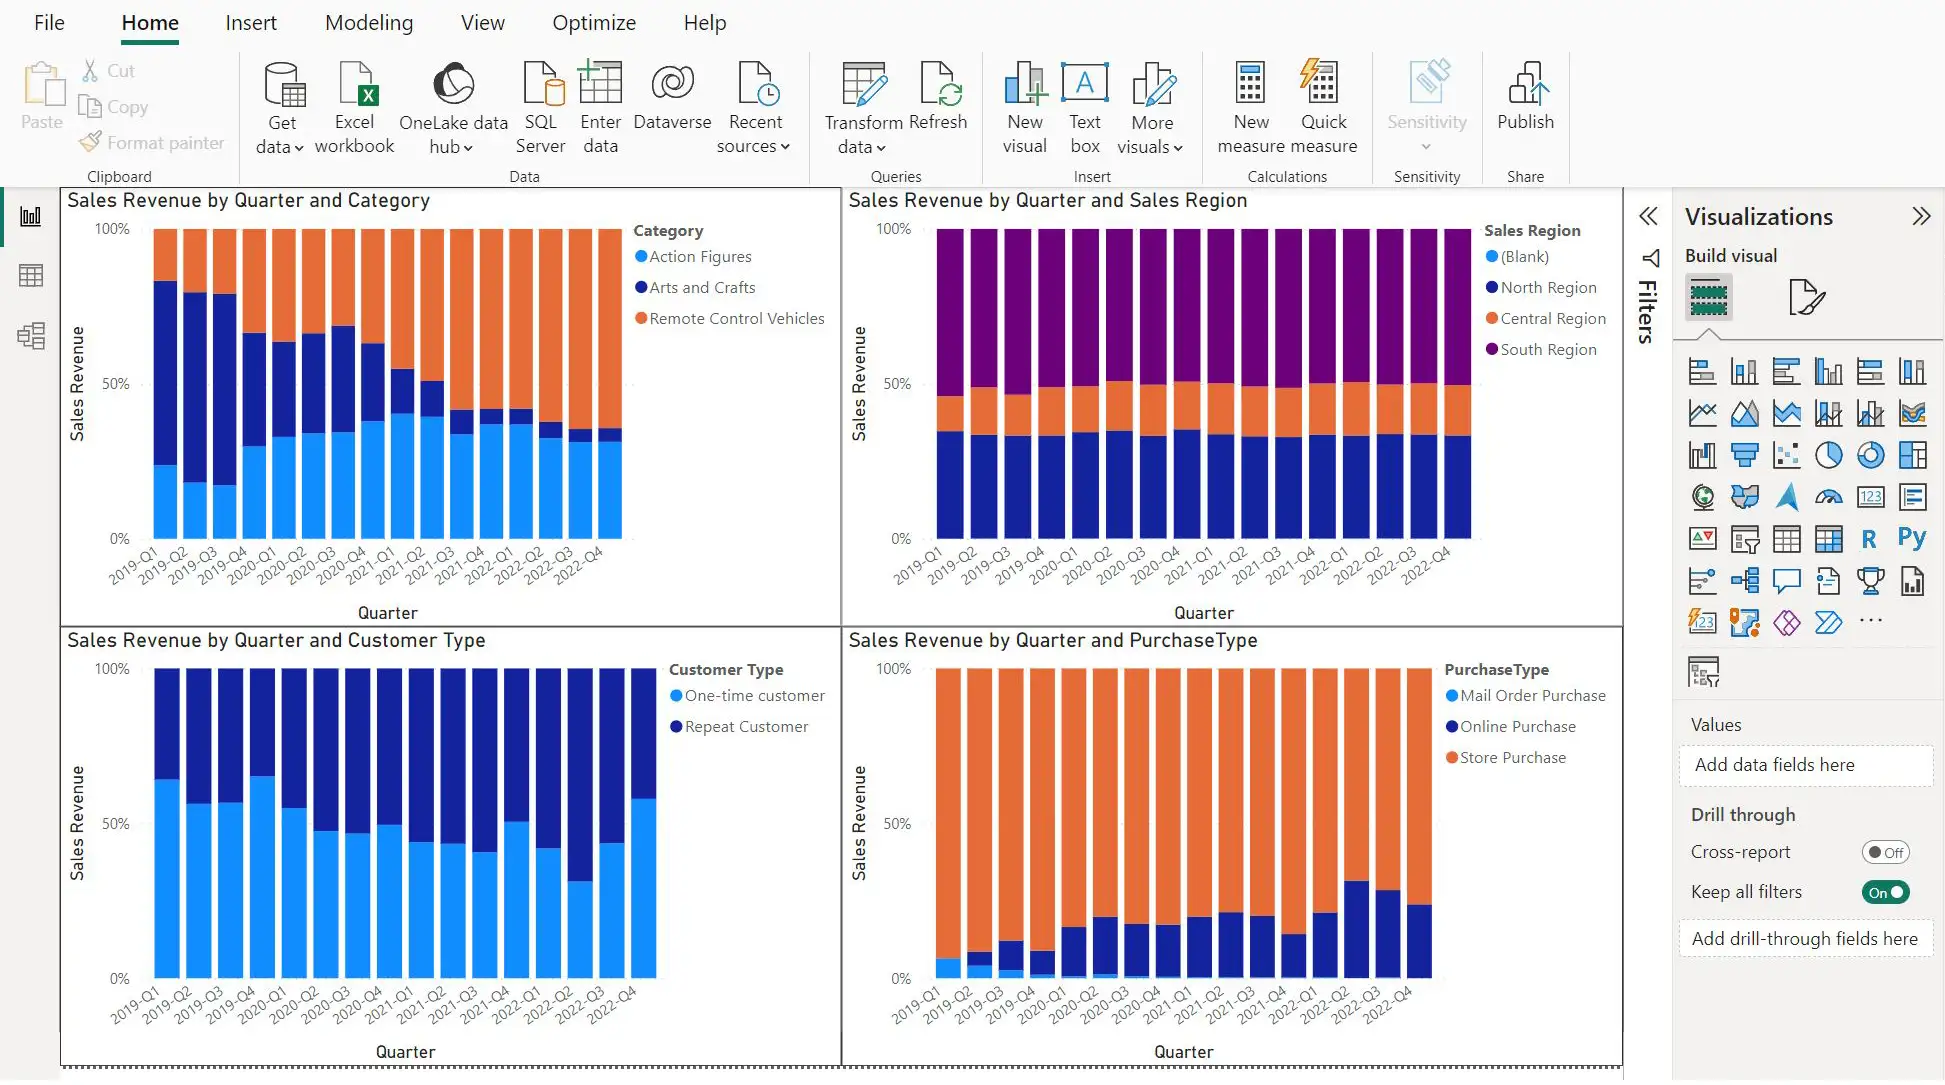
Power BI Desktop
When it comes to building self-service reports, Power BI Desktop is where the magic happens.
We'll import data using the Query Editor, create a dataset and model the data to make it better suited for analysis.
- Query Editor fundamentals
- Dataset creation
- Data modelling basics
- Report design principles
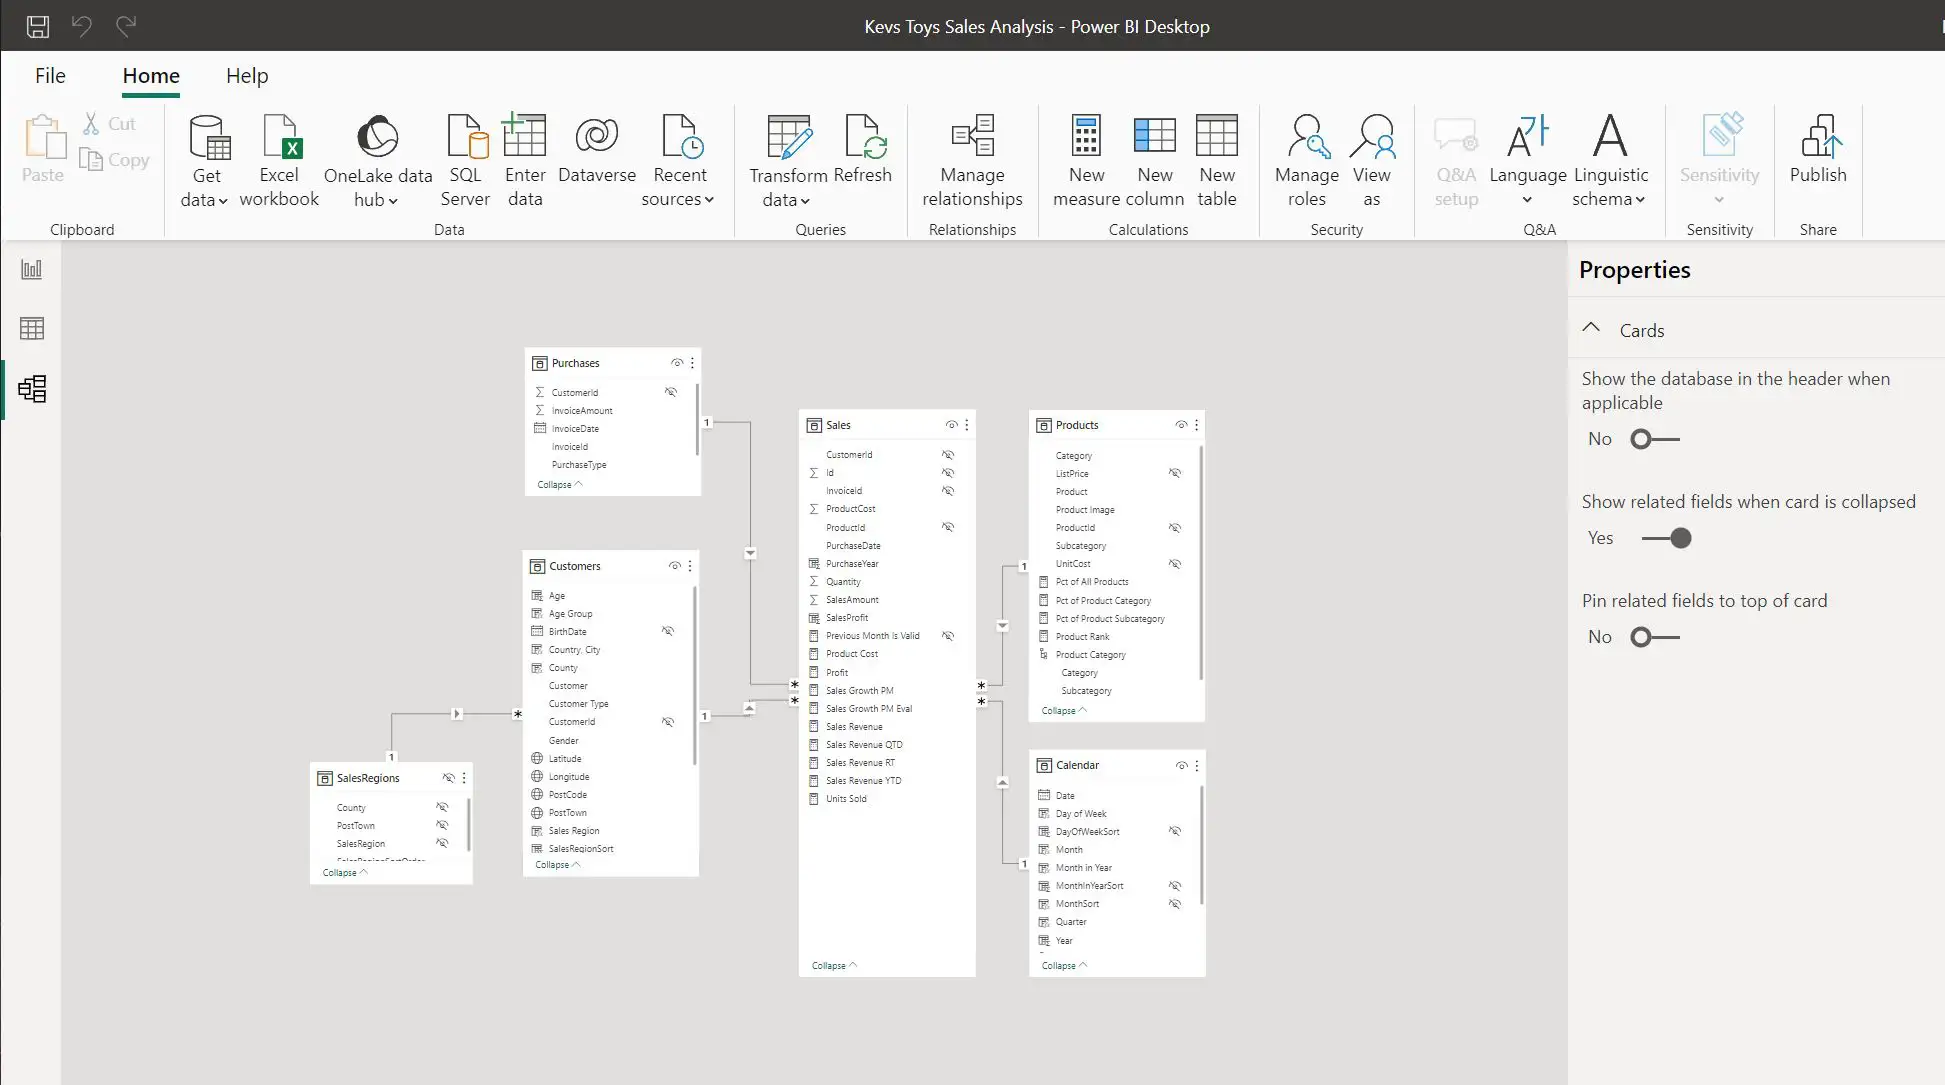
Extract and transform data using Queries
Everything starts with bringing in the data you need.
So we'll be learning to work with the Power Query features of Power BI Desktop to extract data from sources such as Azure cloud storage and transform it into meaningful information.
- Power Query M language
- Data source connections
- Data transformation techniques
- Azure integration
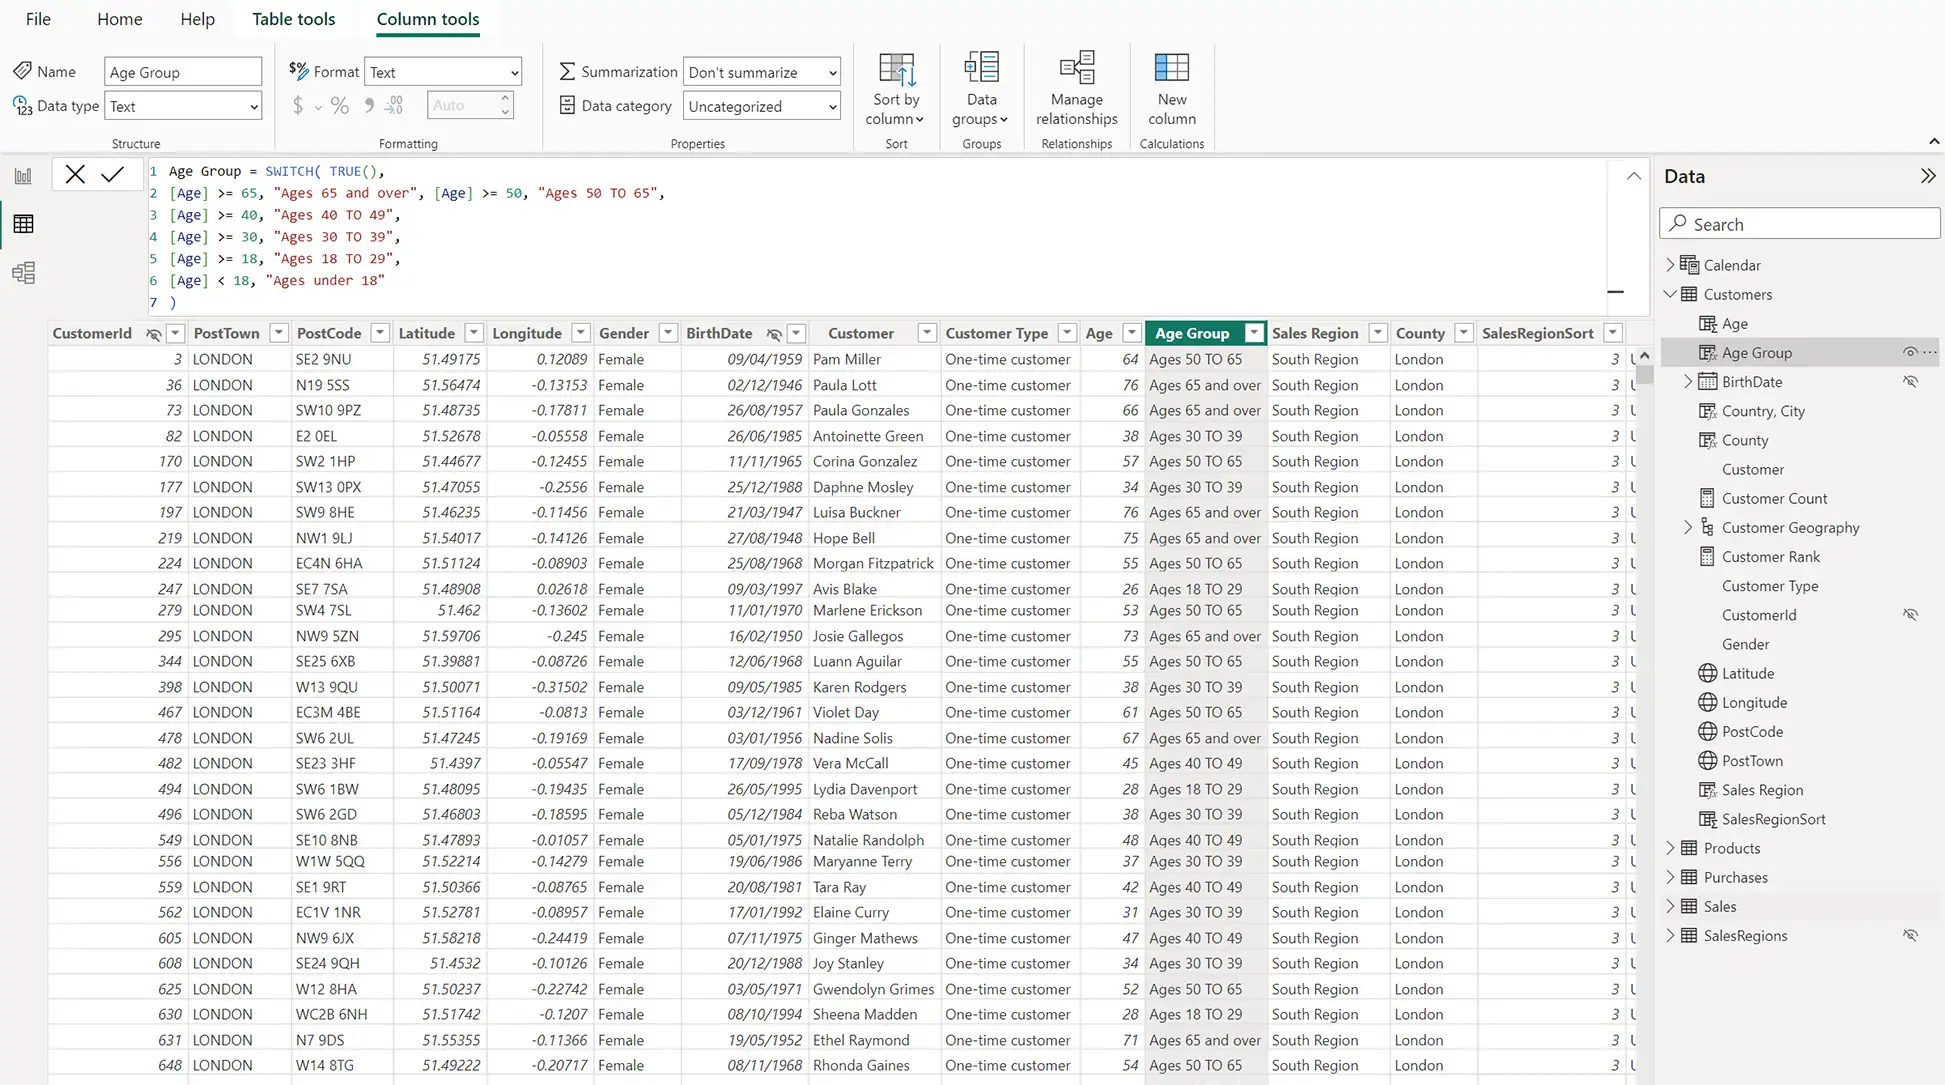
Creating user-friendly data models
The data model – it's what really makes your report work. Putting the 'power' in Power BI, you could say.
We'll be using Data Analysis Expressions (DAX) language to create dynamic measures that update in real time as you interact with the report.
- DAX fundamentals
- Creating calculated columns
- Building measures
- Real-time calculations
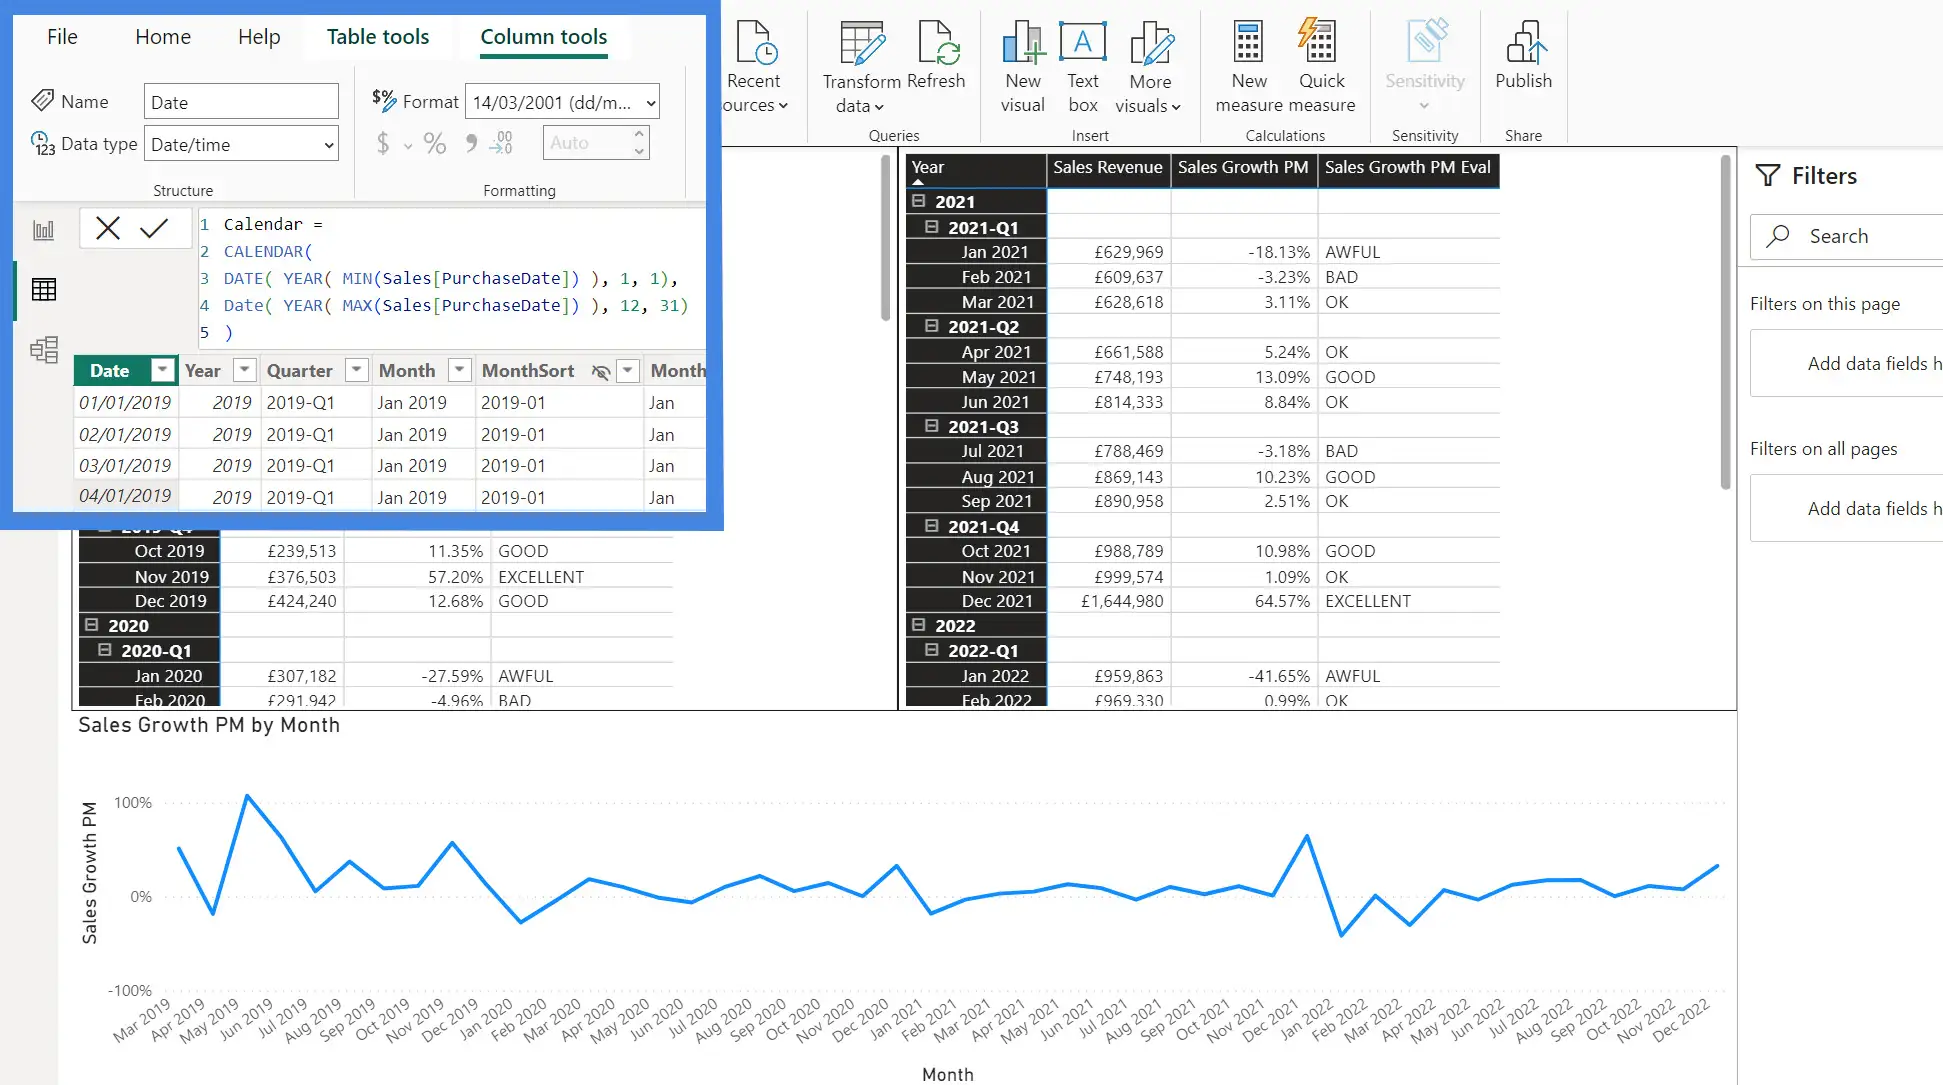
Modelling with time series and hierarchies
The most valuable business insights are often found by slicing and visualising data into relevant categories and hierarchies.
We'll also use a calendar table to produce time-based financial analysis using the DAX time intelligence functions.
- Creating hierarchies
- Calendar tables
- Time intelligence functions
- Financial analysis
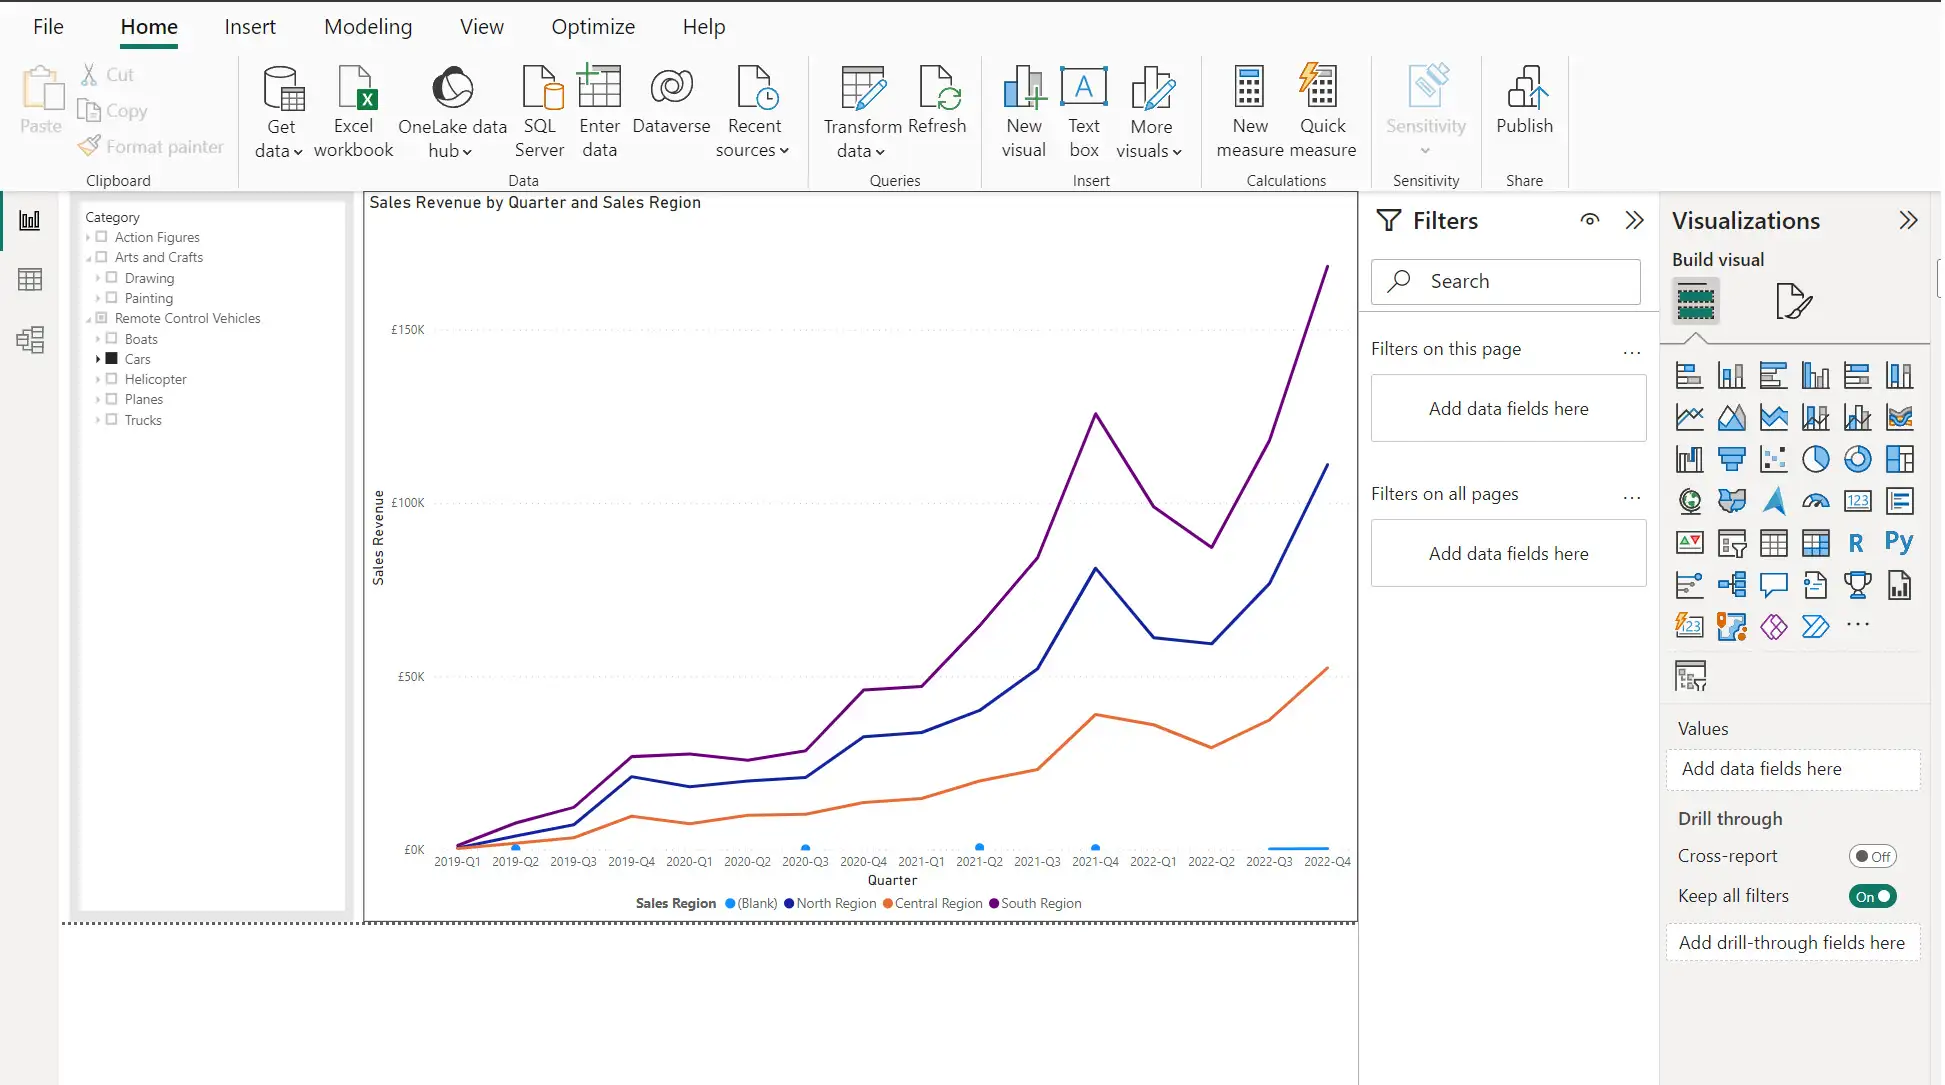
Designing interactive reports
How quickly can we turn data into actionable insight? The answer depends on how well the information is presented.
We'll focus on report design, including the use of custom visuals from the App Store and setting permissions with row-level security.
- Report design best practices
- Custom visuals
- Interactive features
- Row-level security
Creating and deploying solutions
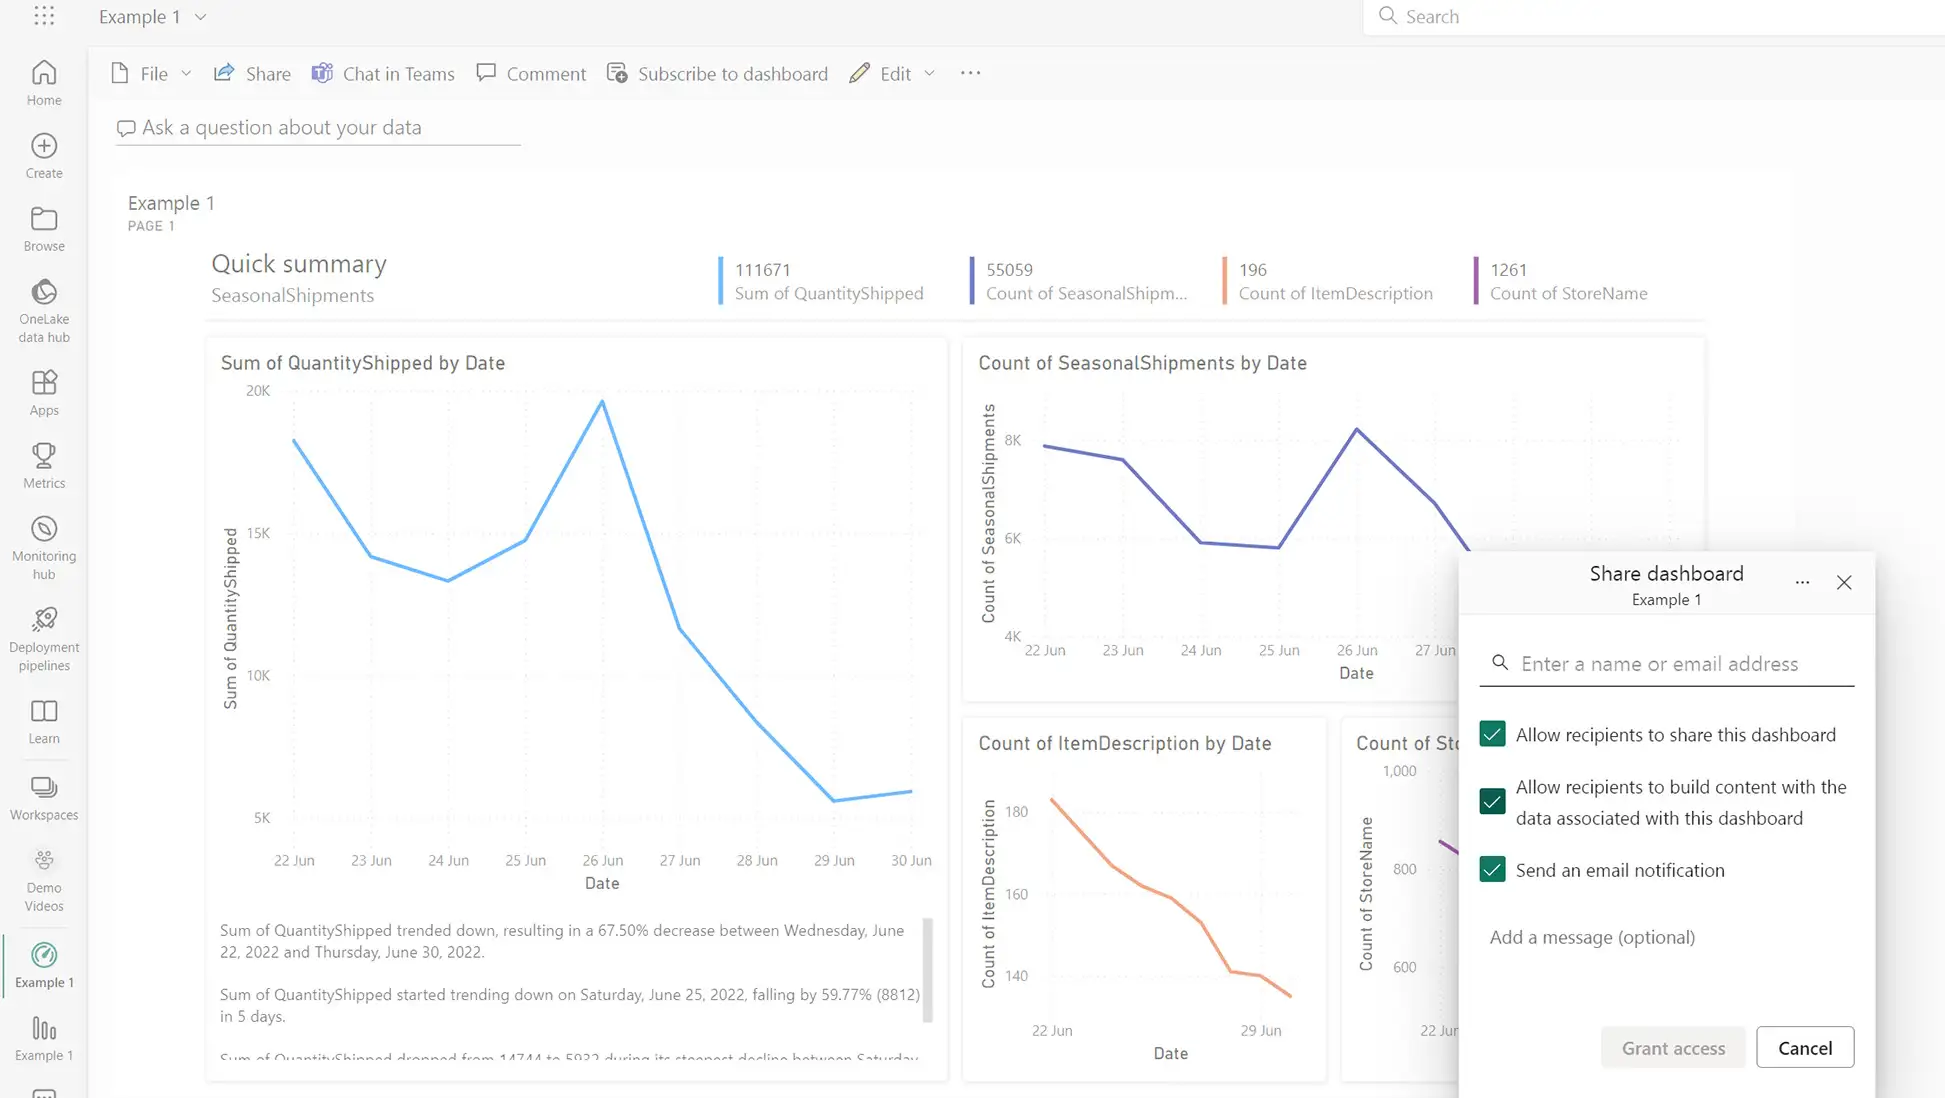
In this module, we'll create and deploy a packaged solution to an audience of business users in a Microsoft 365 environment.
We'll also create a Dashboard that consolidates the most important information from several different reports.
- Solution packaging
- Microsoft 365 deployment
- Dashboard creation
- Report consolidation


