Data literacy training is the structured programme of learning that gives people across an organisation the skills, mindset and tools to read, work with and act on data. An effective UK programme combines (1) the right framework (ADKAR for change, 70:20:10 for learning, a four-pillar model covering learning, governance, technology and innovation), (2) a network of data champions inside each function, (3) executive sponsorship and visible data-first leadership and (4) a structured next step in a recognised tool (commonly Power BI). It's not a one-off course - it's a multi-year capability programme that starts with current skills, defines a target state, then funds, measures and sustains the change.
In this guide:
- The UK digital-skills gap costs ~£23bn a year; closing it could add ~£8.5bn (FutureDotNow, 2025).
- Most data-literacy programmes fail on the human side, not the training side - use ADKAR.
- For BI leads, people directors and SME owners: the structured next step is a recognised tool course.
Most UK organisations are sitting on more data than they know what to do with - and most of their people don't have the skills to act on it. UK government analysis shows 81% of UK businesses handle digitised data but only around 26% use it to generate new insights (gov.uk Business Data Survey). The gap isn't tools - it's data literacy: the ability and mindset to read, work with, analyse and use data ethically to solve real problems. That gap costs the UK economy around £23bn a year in lost productivity, with the upside of closing it estimated at £8.5bn in UK business profitability (FutureDotNow, May 2025).
The problem isn't technology. As David Waller, partner at Oliver Wyman Labs, put it in Harvard Business Review: "The biggest obstacles to creating data-based businesses aren't technical; they're cultural." Most UK organisations now have access to powerful analytics tools. What's missing is the data-literacy capability across the workforce to turn those tools into decisions.
This guide is the practitioner's playbook for building a data-literacy programme in a UK organisation. We'll cover the scale of the UK skills gap, the four-pillar data-culture model, the frameworks that work (Prosci ADKAR, 70:20:10 learning model, the data-champions model), the UK government routes that subsidise data skills and the structured next step that turns programme thinking into actual capability.
What's in this guide
- The UK data culture crisis
- What is a data-driven culture?
- The four pillars of data culture
- UK success stories: organisations getting it right
- Building a data literacy training programme
- Leadership's role in data culture
- Overcoming common barriers
- Getting started: practical steps
- The future of data literacy: AI and beyond
- Sources
- Frequently asked questions
The UK data culture crisis: the numbers don't lie
Before we discuss solutions, let's understand the scale of the challenge facing UK organisations. The gap between data collection and data-driven action is enormous.
of UK businesses handle digitised data (gov.uk)
use it to generate new insights (gov.uk)
annual UK productivity cost of the digital-skills gap (FutureDotNow, 2025)
wage premium for workers with AI skills (PwC AI Jobs Barometer)
That means roughly four in five UK businesses collect data, but only one in four turn it into insights. The rest are essentially hoarding information that never influences a decision. The same UK Business Data Survey shows only 2% of UK businesses use data for artificial intelligence or automated decision-making (12% among large businesses) - a remarkable gap given the noise around AI adoption.
The data-literacy gap inside the workforce
Inside organisations, the picture is just as concerning. The Carruthers and Jackson State of Data Literacy report finds:
- 58% of data leaders report that most of their employees are not data literate
- AI use is rising fast - 40% of surveyed organisations now report AI is used by many employees, up from 21% in 2024 - but data-literacy capability has not kept pace
The trust problem
Business leaders don't fully trust their own data either:
- Only 40% of UK business leaders completely trust their data (Salesforce UK)
- 77% of UK business leaders are worried their company is missing out on the transformational benefits of generative AI (Salesforce UK)
When leaders don't trust the data, they fall back on intuition. That creates a vicious cycle: data isn't trusted, so it isn't used, so investment in data quality isn't prioritised, so data stays untrustworthy. Closing that loop is what data literacy training, done at organisational scale, is for.
The cost of inaction: FutureDotNow estimates the UK's digital skills gap costs ~£23bn annually in lost productivity, with closing the gap potentially adding ~£8.5bn to UK business profitability (May 2025).
Ready to give your team a structured starting point? Our 2-day instructor-led Power BI Masterclass is one practical answer to the data-literacy training question - hands-on with real datasets, designed for UK businesses. If you're still working out which format fits, the Power BI training UK buyer's guide walks through the options. Get in touch to discuss your team's needs.
What is a data-driven culture?
A data-driven culture is more than having access to dashboards or running occasional reports. It's an environment where data-informed decision-making is the norm at every level of the organisation, not just among analysts or executives.
As Deloitte defines it, data culture means establishing "a mindset where making data-driven decisions is the norm, empowering every member of an organisation." This isn't about turning everyone into a data scientist. It's about ensuring that when decisions need to be made, people naturally ask: "What does the data tell us?"
A genuine data-driven culture has several characteristics:
- Data accessibility: Relevant data is available to those who need it, when they need it, without requiring specialist skills to access
- Data literacy: Employees across all functions can interpret data, understand its limitations and apply insights to their work
- Trust in data: Data quality is maintained, and people have confidence that the information they're using is accurate and current
- Leadership example: Senior leaders visibly use data in their decision-making and expect the same from their teams
- Continuous learning: The organisation treats data as a source of learning and improvement, not just reporting
Why technology alone isn't enough
Many organisations make the mistake of thinking that implementing a business intelligence tool will automatically create a data-driven culture. It won't. Tools like Microsoft Power BI are powerful enablers, but without the cultural foundation, they become expensive reporting systems that few people use.
Research consistently shows that technology adoption without cultural change fails to deliver value. Deloitte's 2025 survey found that most organisations achieve satisfactory return on investment from AI initiatives only within two to four years, far longer than the seven to 12 months typically expected for technology investments. The difference between organisations that realise value quickly and those that struggle? It's not the technology. It's how well they've prepared their people and processes.
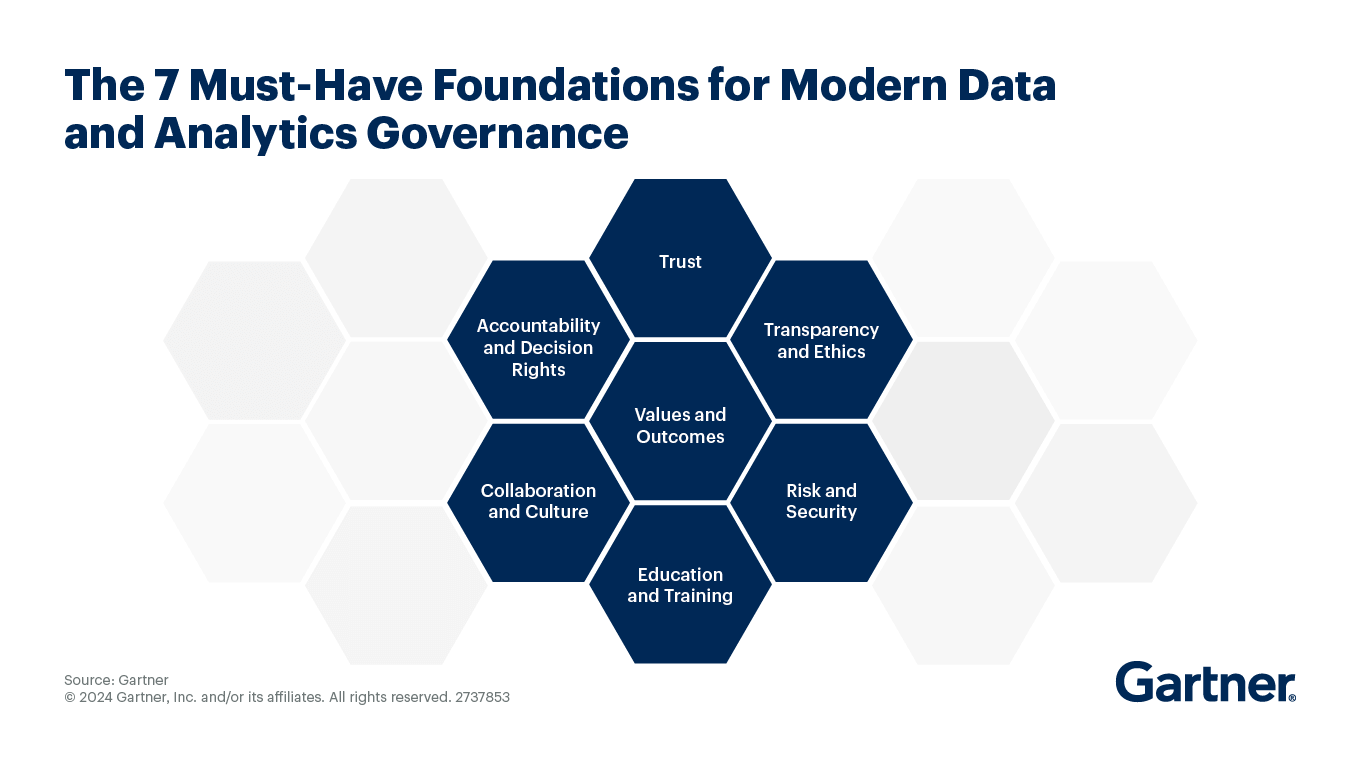
The four pillars of data culture
Building a sustainable data-driven culture requires attention to four interconnected pillars: Learning, Governance, Technology and Innovation. Each pillar supports the others, and weakness in any area undermines the whole structure.

1. Learning
Learning focuses on empowering everyone in the organisation with the knowledge and confidence to incorporate data into their daily work. This doesn't mean everyone needs the same skills. Different roles require different levels of data capability.
The largest group in most organisations are "data citizens" - people who use data through reports and dashboards served to them but don't need to build models or write code. They need training on what analysis is available, how to navigate analytics tools and how to interpret the visualisations they see.
Data analysts and specialists need different support, including user groups that cross departmental boundaries and more detailed training on producing analysis for wider consumption. The key is matching learning pathways to actual job requirements rather than providing generic training that doesn't connect to daily work.
The widely-cited 70:20:10 learning model (originally from Lombardo and Eichinger at the Center for Creative Leadership) is a useful framing for data literacy programmes:
- 70% of learning from on-the-job experience
- 20% from formal training programmes
- 10% from exposure to external events like conferences and hackathons

2. Governance
Governance is about building trust. It means enabling users to access the right data, not restricting access through arbitrary security protocols. But to do this effectively, you need to understand your data estate and, most importantly, who owns data within the organisation.
Clear data ownership ensures data is correct at its source rather than through complex workarounds at the platform level. When people know who to contact about data quality issues and those owners are accountable for maintaining accuracy, trust in data improves across the organisation.
Governance process design should provide guidelines that empower users to seek access to data. Too often, governance becomes a barrier that slows down analysis and frustrates users. The goal is to make it easy to do the right thing with data.
3. Technology
Technology refers to the tools that enable interaction with data, including its storage, processing and presentation. The specific technology chosen matters less than how well it's rolled out, adopted and supported within the organisation.

Users must be empowered and set up for success by understanding what tools should be used for, how to use them effectively and how to request support. "Data clinics" - regular open sessions where people can get help with data questions - are useful for creating rapport between technical and business teams.
For most UK organisations, Microsoft Power BI has become the standard business intelligence platform. Its integration with Microsoft 365, self-service capabilities and relatively accessible learning curve make it well-suited to democratising data access. But even the best tool needs ongoing support and training to deliver value.
The most effective approach is "governed self-service", where IT owns the data modelling (ensuring standards and security) whilst business users own report generation and analysis. Users build reports on an IT-created data model, with clear processes for requesting new data attributes. This balance prevents the chaos of ungoverned self-service whilst avoiding the bottleneck of IT-controlled everything.
4. Innovation
Innovation may not be achievable at the start of a data culture journey, but it becomes possible as the other three pillars mature. As people become more comfortable with data, they naturally start identifying new opportunities for data-driven improvement.
Organisations can foster innovation through dedicated research and development initiatives, hackathons where teams explore new ideas and technologies, and a culture that celebrates experimentation even when experiments don't succeed. The members of the organisation are the incubator for new ideas that will drive the organisation forward.
UK success stories: organisations getting it right
While the UK statistics paint a concerning picture overall, several leading organisations demonstrate what's possible when data culture transformation is done well. These case studies show quantified business outcomes that prove the investment is worthwhile.
 Lloyds Banking Group: machine learning at scale
Lloyds Banking Group, the UK's largest digital bank, invested £3bn in people, technology and data as part of its commitment to helping Britain prosper. The bank recognised that its on-premise machine learning platform limited the number of data scientists who could effectively experiment with advanced models, constraining innovation at a critical time.
Between May 2023 and April 2025, Lloyds migrated 15 modelling systems comprising hundreds of individual machine learning models to Google Cloud's Vertex AI platform. The transformation yielded dramatic results:
- User base expanded from a limited cohort to over 300 data scientists and AI developers working simultaneously
- 80 new machine learning experiments initiated within six months of deployment
- Mortgage income verification reduced from multiple days to seconds
- Zero unplanned platform downtime since migration
- 18+ generative AI systems deployed to production
- 27 tonnes of CO2 emissions reduction through cloud migration
Ranil Boteju, Group Chief Data and Analytics Officer at Lloyds Banking Group, captured the strategic vision: "Data will play a critical part. It's a driving force behind our ambition to help Britain prosper. That's why we will continue to invest in a data-driven culture - one that harnesses the power of data and analytics to create better products and experiences for our colleagues and customers."
 Sainsbury's: democratising data for 12,000 colleagues
Sainsbury's, with 1,400 stores, £28bn in annual sales and 189,000 colleagues, undertook a three-year analytics transformation that represents the most systematic approach to data democratisation documented in UK retail.
The retailer deliberately consolidated its analytics technology to just three platforms: Snowflake for data warehouse infrastructure, Amazon Web Services for cloud platform services and MicroStrategy for analytics delivery. This architectural simplicity enabled rapid scaling of analytics access across the organisation.
store managers and colleagues now accessing analytics
reports viewed weekly across the organisation
man-hours saved annually through automation
The flagship store-level analytics application, deployed across all 1,400 stores, gives real-time visibility into sales, waste, shrink and margin performance. Store managers access insights directly from handheld mobile devices on the shop floor, making data-informed decisions part of daily operations rather than a back-office activity.
During COVID-19, Sainsbury's analytics teams deployed new applications within just one week that enabled rapid reallocation of resources to address staffing and supply chain shortages. The infrastructure enabled geospatial analysis to minimise colleague travel, store hour optimisation and priority-based allocation of essential supplies.
 Tesco: AI-powered personalisation at massive scale
Tesco, with 23 million Clubcard loyalty programme members and 30 years of Clubcard history, deployed artificial intelligence-driven personalisation that demonstrates what's possible when data culture and technology combine effectively.
In May 2024, Tesco launched Clubcard Challenges, using EagleAI's machine learning to assign individually personalised purchasing challenges to members. The AI executes over 190 intelligent decisions per individual to assign each challenge, analysing purchase history, category engagement, spending patterns and reward thresholds.
The results across four campaigns in 2024 were remarkable:
- 10 million customers targeted per campaign
- 289 million personalised vouchers delivered to 7.6 million customers
- 76% conversion rate from page visitors to active participants
- 98% open rate on app notifications
- Over half a billion extra Clubcard points collected by customers
CEO Ken Murphy noted: "Our customers continue to benefit from increasing personalisation and great value with Clubcard." The programme contributed to Tesco's "biggest ever Christmas performance" in 2024.
 John Lewis Partnership: analytics for 74,000 employee-owners
John Lewis Partnership, the UK's largest employee-owned business with over 74,000 employee-owners across John Lewis department stores and Waitrose food shops, demonstrates how complex, multi-channel retail operations can successfully democratise data access.
The organisation centralised customer data through Salesforce implementation, then used Tableau to train 8,000 users in the first implementation phase. This enabled 10,000 Partners to independently explore real-time sales and inventory data without depending on specialist analytics teams.
Quantified outcomes: John Lewis achieved £1m annual call-centre cost savings, a 75% reduction in marketing campaign production time (campaigns now deployed within a single day) and significant waste reduction in bakery through predictive analytics.
NHS Wrightington, Wigan and Leigh Trust: data improving patient care

The healthcare sector shows how data culture directly impacts patient outcomes. Wrightington, Wigan and Leigh NHS Foundation Trust, serving 320,000 people in Greater Manchester with 4,800 professionals, migrated from specialist analytics to a self-service model.
The Trust's philosophy shift was fundamental: moving from 80% of business intelligence team time spent developing requested applications to 80% spent exploring data and identifying new insights. This reversal enabled data specialists to focus on value-added analysis rather than report generation.
The measurable outcomes directly affected patient care:
- 30-minute reduction in A&E waiting times
- Propelled the Trust into the top 10 nationally on access metrics
- Better workforce scheduling through patient volume prediction
- Optimised operating theatre utilisation
Across the NHS more broadly, documented efficiency savings show the sector-wide impact. The Humber and North Yorkshire health system documented £4.1m in efficiency savings through shared care record implementation, while South Yorkshire's integrated care system projects cumulative efficiency savings of £22m over five years.
Want your team to deliver outcomes like these? Capability is the unlock. Our 2-day Power BI Masterclass gets a team to a working baseline on Power BI design, modelling and report-building in two days; the Power BI training UK buyer's guide covers what else is in the market.
Building data literacy across your organisation
Data literacy is the ability and mindset to read, work with, analyse and use data ethically to solve challenges, drive innovation and create value. It's not just a technical skill. It includes critical thinking about data, understanding its limitations and knowing when and how to apply insights.
The UK data literacy crisis
The scale of the UK's data literacy challenge is stark. According to FutureDotNow research:
- 52% of working-age adults cannot complete all 20 basic digital tasks that industry and government agree are essential for work
- One in two young people cannot perform all essential digital tasks
- One in two academics holding degrees or PhDs lack complete digital skills
- One in three people earning over £75k annually lack complete digital skills
- One in five people working in the technology sector lack all essential digital skills
Within organisations, the picture is equally concerning. 58% of data leaders report that most of their employees are not data literate. And half of UK workers had not received any data skills training within the previous two years, despite both high employer demand for data skills and expressed employee interest in development.
Building a data literacy programme
The Prosci ADKAR model provides a useful framework for thinking about what individuals need to change their behaviour. ADKAR identifies five elements that must be present for change to succeed: Awareness (understanding why change is needed), Desire (genuine motivation to participate), Knowledge (knowing how to change), Ability (practical skills to put in place new behaviours) and Reinforcement (mechanisms to sustain change over time).

Many data literacy programmes fail because they focus exclusively on the Knowledge element through training, whilst neglecting the other four. Employees complete training but lack genuine desire to change their working practices, or they have the knowledge but lack the ability to apply it in their daily work, or there's no reinforcement mechanism to sustain new behaviours once initial enthusiasm fades.
Deloitte's experience across numerous client projects has identified seven key components for building an effective data literacy programme:
- Find a sponsor: Programmes with strong executive sponsorship are able to catalyse new behaviours and amplify change. Find a passionate and influential sponsor to drive your data literacy initiatives from the front.
- Define a clear vision: Understand what cultural behaviours you want to drive and the corresponding skills which underpin them. You can't create a data-literate organisation unless you understand what skills your various personas need.
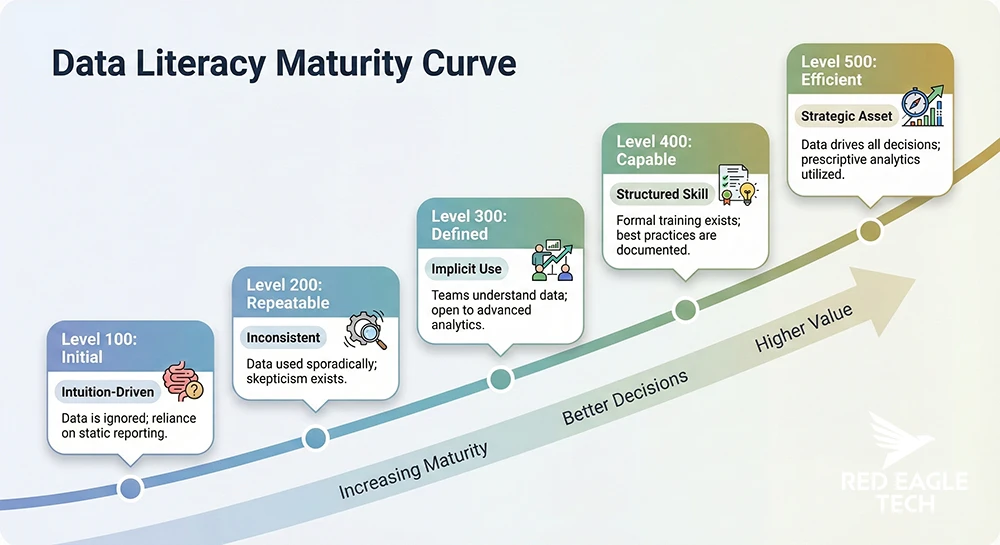
- Understand the gap: Assess how data-literate your workforce currently is. A basic data literacy evaluation will help you understand how much time and effort is required to move between proficiency levels.
- Map curriculum to learner personas: Ensure you understand your personas, such as frontline staff versus back office versus executives, so you can provide content and training which is pertinent and delivered in a way that will have impact.
- Focus first on foundational data skills: While terms like generative AI and neural networks sound exciting, they are at the far end of the spectrum. Most employees need to understand basic data analysis principles before tackling advanced topics.
- Seek out opportunities to apply new skills: Research shows 80% of training content is forgotten within a month unless the person has an opportunity to apply their new skills. As a leader, make space for employees to safely test out their new capabilities.
- Celebrate successes: While your organisation is on their journey to becoming data-literate, there will be moments where it gets difficult. One way to encourage people to stick with it is to provide them with a "finish line" that celebrates their achievements, such as graduation ceremonies.
UK government skills initiatives
UK organisations have access to several government-backed routes for developing data skills. Skills Bootcamps offer intensive flexible training (typically up to around 16 weeks) for those aged 19 and over, with employer-linked outcomes including guaranteed interviews; they cover data, software development, digital marketing and a growing list of digital adjacencies. Get Tech Certified (the UK government-backed certifications scheme with vendor partners) provides public-sector workers with access to free certification pathways across data, cloud and AI - check the current gov.uk listing for eligibility and live partner details before building a programme around it.
For longer-term capability building, apprenticeships combine work-based learning with formal instruction. UK government statistics show 90.8% of apprenticeship End-Point Assessments were passed on the first attempt over the March 2024 - February 2025 reporting period (gov.uk EPA statistical report). Data apprenticeships - including the Level 4 Data Analyst standard - sit inside this system and are a credible mid-tier route into structured data capability.
The data champions model
One effective approach is to identify data champions within each department. These are people who have a natural affinity for data and analytics and can help their colleagues troubleshoot issues, develop skills and build enthusiasm for data-driven approaches. Critically, champions should be identified and invited based on genuine enthusiasm rather than assigned through top-down mechanisms. Programmes that appoint champions without genuine commitment often exist on paper only.
When identifying potential champions, look for three types of people: "go-to colleagues" whom others naturally approach with questions, "domain masters" who possess deep knowledge of why data matters to their specific business area and "enthusiasts" who view data and new technologies as opportunities rather than threats.
Data champions serve as the bridge between central analytics teams and the wider business. They understand both the technical possibilities and the practical realities of their department's work. They can translate between data speak and business speak, making analytics relevant and actionable for their colleagues.
Supporting champions requires genuine investment. They need early access to products and training so they can become experts capable of helping colleagues. They benefit from formal communities where they can share challenges and solutions with other champions. And they need visible recognition from leadership and integration of their champion activities into formal performance reviews, treating championship as a genuine career pathway rather than an extracurricular activity.
Leadership's role in data culture transformation
Data culture transformation cannot succeed without genuine leadership commitment. Industry surveys consistently identify lack of leadership buy-in as the leading obstacle to better data literacy - ahead of resources, cultural resistance and access to training.
The leadership trust gap
Perhaps the most significant barrier is that many senior leaders don't fully trust or feel comfortable with data-driven approaches. Only 40% of UK business leaders completely trust their data (Salesforce UK), yet 77% are worried their company is missing out on the transformational benefits of generative AI (Salesforce UK). The leadership behaviour gap - distrust of data combined with anxiety about falling behind on AI - is the cultural pinch point that data literacy training has to solve.
This creates an obvious problem. If leaders visibly prefer gut instinct to data, their teams will follow suit. Why invest time in data analysis if the boss is going to make decisions based on intuition anyway?
What effective data leadership looks like
Leaders who successfully drive data culture transformation do several things consistently:
- Model data-first behaviour: They visibly reference data in meetings, ask for evidence to support proposals and share their own decision-making process
- Allocate resources: They ensure time and budget for data literacy training, tool implementation and data quality improvement
- Remove barriers: They actively work to eliminate obstacles to data access and use, rather than adding bureaucratic controls
- Celebrate data-driven wins: They publicly recognise when data-informed decisions lead to positive outcomes
- Accept uncertainty: They understand that data provides insight, not certainty, and create psychological safety for teams to make recommendations based on imperfect information
The payoff: The wage signal is unambiguous - workers with AI skills now command a 56% wage premium, up from 25% the previous year (PwC AI Jobs Barometer). Organisations that build data and AI literacy into the workforce close the £23bn UK productivity gap from the demand side; those that don't pay it as a cost.
Overcoming common barriers to data culture
Building a data-driven culture means confronting several persistent barriers. Understanding these challenges helps you address them proactively rather than being surprised when they emerge.
Data quality and trust issues
Poor data quality is the most frequently cited barrier to effective data use. When asked about the primary impediment to better data management, 59.9% of UK respondents identified inadequate data quality. Beyond quality issues, 44.7% cite lack of trust in data integrity, and the same percentage report that analytics departments fail to keep pace with business initiatives.
Practical problems compound these issues. Having multiple copies of datasets makes it impossible to identify data ownership (43.7%), and administrative friction when locating original datasets (31.8%) slows down analysis and introduces errors.
The solution: Start with data governance. Establish clear ownership for key datasets, put in place quality monitoring and create processes for reporting and resolving data issues. Don't wait for perfect data before starting your data culture journey - use Power BI dashboards to make quality issues visible, which often accelerates their resolution.
Resistance to change
Risk-averse mindsets and resistance to change from both workers and managers rank among the most frequently cited barriers to technology adoption. But resistance is often misunderstood. What leaders interpret as stubborn unwillingness to change frequently reflects legitimate concerns: fear of the unknown, uncertainty about how changes will affect roles, doubt about the capacity to adapt.
Deeper psychological factors also drive resistance. McKinsey research found that only 28% of executives believe their organisations make generally good strategic decisions. The root cause? Managers struggling with cognitive biases including confirmation bias (seeking data that confirms pre-existing beliefs) and overconfidence. Better data alone won't solve this if decision-making processes remain vulnerable to these biases. The quality of the decision process matters six times more than the quality of analysis.
People also hold deeply ingrained mental models about data that operate at implicit levels: "Data analysis is for specialists, not relevant to my work," "My intuition is more reliable than data," "Data is used for surveillance and control." These assumptions often go unexamined because people don't recognise them as assumptions rather than facts.
The solution: Frame data as a tool that enhances human judgement rather than replacing it. Involve sceptical team members early in initiatives, asking for their input on what data would be useful. When data confirms their intuition, celebrate it. When it contradicts expectations, use it as a learning opportunity rather than a criticism. Most importantly, address the process, not just the tools. Create structured decision-making processes that require actively seeking disconfirming evidence and accepting findings that conflict with prior beliefs.
Skills and talent shortages
IT and data skills remain the hardest skills to find in the UK labour market, a position unchanged for the last five years. According to the 2025 Talent Shortage survey, 51% of IT firms plan to hire, but 75% struggle to find qualified candidates. Almost half of UK businesses (46%) reported struggling to recruit for roles requiring data skills over the previous two years.
The solution: Focus on developing existing employees rather than relying solely on external recruitment. The data champions model lets you draw on people who already understand your business context. Partner with training providers for structured upskilling programmes, and consider apprenticeship routes for building long-term capability.
Competing priorities
Among Chief Data Officers surveyed, 47% reported that competing organisational priorities hinder their ability to realise the full value of data, while 48% cite budget and resource limitations as key challenges. Data transformation initiatives often lose out to more urgent operational demands.
The solution: Connect data initiatives to business outcomes that matter to leadership. Show how improved data capabilities will address their priorities, whether that's cost reduction, revenue growth or risk management. Start with quick wins that show value, building momentum for larger investments.
Getting started: practical steps for UK organisations
Building a data-driven culture is a multi-year journey, not a project with a defined end date. Here's how to get started.
1. Assess your current state
Before you can improve, you need to understand where you are. Conduct a data maturity assessment covering:
- What data do you collect, and how is it stored and managed?
- Who owns key datasets, and how is quality maintained?
- What analytics tools are in use, and how widely adopted are they?
- What level of data literacy exists across different functions?
- How do leaders currently use data in decision-making?
Data maturity assessment
How data-mature is your business? Evaluate your organisation's data capabilities and identify gaps in your data-driven culture.
2. Start with a business problem
Don't try to transform everything at once. Identify a specific business challenge where better data could make a measurable difference. Perhaps it's understanding why customers churn, optimising inventory levels or improving sales forecasting. Focus your initial efforts on solving this problem well.
3. Invest in the right tools
For most UK organisations, Microsoft Power BI provides the right balance of capability and accessibility. Its self-service features allow business users to create their own reports without IT dependency, while its integration with Microsoft 365 means it works with tools people already use. Power BI Pro costs £10.80 per user per month, making it accessible for organisations of all sizes.
4. Build capabilities systematically
Develop a learning programme that addresses different needs across your organisation. Train data citizens on interpreting dashboards and reports. Develop data champions who can support their departments. Build specialist capabilities where you need them. Remember the 70:20:10 principle: most learning should happen through applying skills on the job.
5. Measure and communicate progress
Define how you'll measure the success of your data culture initiative. This might include:
- Data literacy assessment scores before and after training
- Adoption rates for analytics tools
- Number of data-informed decisions documented
- Time saved on reporting and analysis
- Business outcomes from data-driven initiatives
Communicate progress regularly to maintain momentum and demonstrate value to stakeholders.
The future of data culture: AI and beyond
The organisations building data-driven cultures today are preparing for a future where artificial intelligence amplifies human analytical capability. By 2026, 75% of customer-facing applications will embed analytics capabilities, and conversational AI will enable business users to ask questions in plain English and receive instant visualisations and recommendations.
Microsoft's Power BI Copilot already enables natural language queries, allowing users to ask "What were our top-selling products last quarter?" and receive AI-generated insights without writing a single line of code. This isn't science fiction. It's happening now, and the organisations with strong data cultures will be positioned to leverage these capabilities immediately.

The World Economic Forum's Future of Jobs Report 2025 projects 78 million net new jobs this decade, with the fastest-growing roles in data analytics, AI and related fields. But beyond technical roles, employers increasingly value skills that complement AI: creative thinking, resilience, curiosity and analytical mindset. Building a data-literate workforce today prepares your people for this future.
The AI skills gap is widening fast. Workers with AI skills already command a 56% wage premium (up from 25% the previous year, PwC AI Jobs Barometer). UK organisations report AI use rising sharply at the employee level - 40% now report AI is used by many employees, up from 21% in 2024 (Carruthers and Jackson) - and 77% of leaders worry about missing the transformational benefits of generative AI (Salesforce UK). The organisations that invest in data literacy now will find the transition to AI-augmented analytics far smoother than those scrambling to catch up.
Building data culture is a journey, not a destination
The UK faces a genuine data culture crisis. Most businesses collect data but don't use it effectively. Most employees lack basic data literacy. Most leaders prefer intuition to evidence. The costs of this deficit are measured in billions of pounds of lost productivity and missed opportunity.
But the organisations that get this right see transformative results. Faster decisions. Better innovation. Stronger employee engagement. Real competitive advantage that's difficult for competitors to replicate because it's embedded in how the organisation thinks and operates.
The technology exists. Tools like Power BI make powerful analytics accessible to everyone. What's needed is the cultural change to make data a natural part of how your organisation works.
Ready to start building data literacy across your organisation? Our 2-day Power BI Masterclass is one structured way to take a team from spreadsheet-only to working in Power BI in two days; the Power BI training UK buyer's guide walks through other course shapes if that's not the right fit. Contact us today for a free consultation.
Sources
- FutureDotNow - UK digital skills gap report (May 2025; £23bn annual cost, £8.5bn profitability uplift, 52% essential digital tasks gap) - futuredotnow.uk/lack-of-digital-skills-in-workforce-costing-uk-over-23-billion-per-year
- UK Government - Apprenticeship End-Point Assessments statistical report, March 2024 - February 2025 (90.8% first-attempt pass rate) - gov.uk/government/publications/apprenticeship-end-point-assessments-statistical-report-march-2024-to-february-2025
- UK Government - The UK Data-Driven Market (81% businesses handle digital data; 26% generate insights) - gov.uk/government/publications/the-uk-data-driven-market/the-uk-data-driven-market
- UK Government - Quantifying the UK Data Skills Gap (full report) - gov.uk/government/publications/quantifying-the-uk-data-skills-gap/quantifying-the-uk-data-skills-gap-full-report
- PwC - AI Jobs Barometer (56% wage premium for AI skills) - pwc.com/gx/en/services/ai/ai-jobs-barometer.html
- Carruthers and Jackson - State of Data Literacy report (58% data leaders say employees not data literate; AI use rising 21% to 40%) - carruthersandjackson.com/new-report-finds-ai-use-is-soaring-but-data-leaders-point-to-stagnation-in-employees-data-literacy
- Salesforce UK - leaders trust in data + GenAI concerns (40% completely trust data; 77% worried about missing GenAI) - salesforce.com/uk/news?p=69033
- Open Data Institute - Data literacy and the Data Skills Framework - theodi.org/news-and-events/blog/data-literacy-what-is-it-and-how-do-we-address-it-at-odi
- MIT Sloan Management Review - How to build data literacy in your company - mitsloan.mit.edu/ideas-made-to-matter/how-to-build-data-literacy-your-company
- The Data Literacy Project (Qlik-led) - module catalogue and frameworks - thedataliteracyproject.org
- Prosci - ADKAR change management model - prosci.com/methodology/adkar
- 70:20:10 learning model - Lombardo and Eichinger, Center for Creative Leadership (general industry attribution)
- Harvard Business Review - David Waller on the cultural obstacles to data-based businesses - hbr.org
- Experian - 2019 Global Data Management report (control over information impedes 70% of businesses) - experianplc.com/newsroom/press-releases/2019/control-issues-see-businesses-struggling-to-realise-data-s-full-potential
Frequently asked questions

About the author
Ihor Havrysh
Software Engineer
Software Engineer at Red Eagle Tech with expertise in cybersecurity, Power BI, and modern software architecture. I specialise in building secure, scalable solutions and helping businesses navigate complex technical challenges with practical, actionable insights.
Read more about Ihor