In this guide:
- What's quick to pick up, and what genuinely takes work
- A realistic timeline - hours, weeks and months, stage by stage
- What makes your learning curve steeper or gentler, and how to learn it efficiently
Written for the people deciding whether to take it on - analysts, managers and finance staff weighing up whether Power BI is worth the time to learn.
"Is Power BI hard to learn?" is really two questions wearing one coat. Hard to start? Not very. Hard to get genuinely good at? That part is more real work than the software's drag-and-drop reputation lets on. The gap between those two answers is the whole story, and it's the gap this guide is about.
Ask the question online and you tend to get two unhelpful replies. Training providers, with a course to sell, say it's wonderfully easy. Forum threads, written straight after a bruising afternoon with DAX, say it's brutal. Both are describing something real - they're just describing different parts of the same curve.
We run a Power BI course ourselves, so we have a stake in the answer. Rather than pretend otherwise, what follows is the realistic version: where the curve is gentle, where it's steep, how long each stage actually takes, and the points where a course earns its place against simply teaching yourself.
What this guide covers
- What Power BI is, and why its basics genuinely are quick to learn
- Where people actually struggle - DAX, data modelling and Power Query - and why
- Whether you need a technical or coding background to learn it
- A realistic stage-by-stage timeline, from first dashboard to job-ready
- What makes your own learning curve steeper or gentler
- Self-teaching versus structured training, and how to learn Power BI efficiently
- Whether Power BI is worth learning in the UK in 2026
1. Is Power BI hard to learn? The short answer
Power BI is Microsoft's business intelligence tool, and it was built to be picked up by ordinary business users rather than developers. You connect to your data, drag a field onto a canvas, and Power BI draws the chart for you. That design is why the front door is genuinely easy: most people produce something useful on their first afternoon.
So the answer to "is Power BI hard to learn" is no - and then yes. No, because the basics are quick and the tool does a lot of the work. Yes, because Power BI has real depth underneath the drag-and-drop surface, and reaching it means learning two things that don't come for free: DAX, the formula language, and data modelling, the craft of structuring data well.
The shape people describe again and again is an easy front door and a steeper middle. You'll feel capable fast, then hit a stretch where progress slows and the tool stops being obvious. That stretch is normal. It is not a sign you've chosen the wrong tool or that you're not cut out for it - it's simply where Power BI stops being a chart-maker and starts being a proper analytics platform.
Put plainly: if you can use Excel and you're willing to put in regular, focused practice, you can learn Power BI. The basics take days, confident everyday use takes a few weeks, and job-ready proficiency takes a few months. Don't be lulled by the easy start, and don't be scared off by the horror stories - the realistic answer sits between them, and the rest of this guide is that answer in detail.
2. What's genuinely quick to pick up
Power BI's beginner-friendly reputation is earned. A clear set of skills really is quick to acquire, and it's worth knowing what they are, because this is the part that gets you a working result and the confidence to keep going.
Connecting to data. The "Get Data" button connects to Excel files, databases, websites and hundreds of other sources. For common cases - an Excel workbook, a CSV, a SharePoint list - it's a few clicks, and you're looking at your data inside Power BI within minutes.
Building visuals. This is the genuinely easy bit. Drag a field onto the report canvas and Power BI creates a visual automatically. Swap the chart type from a gallery, drop in another field, and it updates. There's no syntax to remember to get a chart on the page.
Filters and slicers. Adding a slicer so a reader can filter by region or date is drag-and-drop. Power BI's visuals also cross-filter each other by default - click a bar on one chart and the rest of the page responds - with nothing to configure.
Publishing and sharing. Pushing a finished report to the Power BI Service so colleagues can see it is a single button. Pinning visuals to a dashboard is drag-and-drop too.
How quick is quick? A focused beginner can build a first working dashboard in roughly three to five hours, and structured beginner courses - including short UK workshops - routinely cover loading data, building reports and a first look at the query editor in four to six hours. If your goal is to connect to a spreadsheet and produce a tidy, interactive report, you are days, not months, away from it.

3. Where people actually struggle
If the basics are quick, why does Power BI have a reputation for being hard? Because the easy front door opens onto three areas that genuinely take work. None of them is beyond a motivated learner, but each is the point where clicking around stops being enough and real understanding starts.
DAX. DAX is the formula language behind Power BI's calculations. Its functions look reassuringly like Excel's - SUM, AVERAGE, COUNTROWS - which is exactly what catches people out. DAX doesn't calculate cell by cell; it calculates using evaluation context, and the same formula can return different numbers depending on the filters applied and the row being evaluated.
The function that ties learners in knots is CALCULATE, which quietly changes that context as it runs. DAX is fairly summed up as easy to start and hard to master: a basic measure is simple, but using DAX correctly across a real report is the skill that takes months. A related early stumble is the difference between measures and calculated columns - they look interchangeable and are not.
Data modelling. Power BI works best when your data is arranged as a star schema - separate tables for facts and for dimensions, joined by relationships - rather than one wide table with everything in it. The "one big flat table" habit, imported straight from a spreadsheet, is the single most common modelling mistake: it bloats the model, slows reports and makes calculations harder than they need to be. Modelling isn't a feature you click; it's a way of thinking about data, and it rewards being taught properly.
Power Query and the M language. Power Query is where you clean and reshape data before it reaches the model. The good news: its point-and-click interface writes the underlying M code for you, so most people never type M by hand at first. The catch is that the generated code stays invisible until performance matters, at which point query folding and hand-written M become things you have to understand.
The trap for Excel users: the instinct to treat Power BI like a spreadsheet - one flat table, formulas bolted on everywhere, cell-by-cell thinking - is what makes it feel hard. The skills transfer; the spreadsheet habits don't. The learners who struggle most are usually fighting the tool, not failing to understand it.
4. Do you need to be technical or know how to code?
This is the worry that stops people starting, so it's worth answering plainly: no, you do not need to be a programmer to learn Power BI to a genuinely useful standard.
Power BI is aimed at business users. You can connect to data, model it, build dashboards and publish them without writing a line of conventional code. DAX, the part that feels most code-like, is a formula language - much closer to writing Excel formulas than to programming in Python or C#. It has functions, it has variables, and you build it up a step at a time. It is taught to non-programmers every day.
The M language behind Power Query is closer to true programming, but, as section 3 noted, the interface writes it for you. Early on you very rarely need to read or write M directly. It becomes relevant later, for advanced data preparation, and by then you've earned the context to make sense of it.
A fair way to think about it is two levels. "Report builder" competence - connecting to data, building a clean model, writing everyday measures, publishing reports - needs no coding background and is reachable in weeks. "Developer" competence - complex DAX, performance tuning, advanced M, row-level security on large models - is more demanding and edges toward a developer mindset, and that takes months. Most people who ask "is Power BI hard to learn" want the first level, and the first level is open to a non-technical analyst, manager or finance professional.
You don't need to be a mathematician either. Power BI deals in arithmetic and logic - sums, averages, percentages, conditions - not advanced maths. If you're comfortable with the calculations you'd already do in Excel, you have enough. What helps far more than maths is being clear about the question you're trying to answer, and being willing to think in a structured way about how your data fits together.
5. How long does it take to learn Power BI?
"How long does it take to learn Power BI" gets wildly different answers online - a weekend, a fortnight, six months - and they're all sort of right, because they measure different end points. Learning to build a report is not the same as being job-ready, which is not the same as being an expert. Here's a realistic, staged view, assuming regular practice rather than the odd interrupted hour.

| Stage | What you can do | Rough time, with regular practice |
|---|---|---|
| First report | Connect to data, build a basic interactive dashboard, add a slicer, publish it | A few hours to a few days |
| Confident basics | Reliable multi-page reports, slicers, simple DAX measures, scheduled refresh | 2-6 weeks |
| Intermediate | Sound star-schema models, intermediate DAX, Power Query transformations | 2-3 months |
| Job-ready | Trustworthy reports end to end; you'd hold your own in a Power BI role | 3-4 months |
| Advanced | Complex DAX, performance tuning, row-level security, large models | 6-12 months |
Two things change those numbers. The first is intensity: a few hours every week gets you there far faster than an occasional session, because Power BI concepts build on each other and a cold start each time wastes the warm-up. The second is whether you're learning with structure or piecing it together yourself - more on that in section 7. Treat the table as a typical path, not a promise: someone immersed in it daily moves quicker, and someone fitting it around a full workload moves slower.
The encouraging part is the front of the table. Within your first week or two you'll already be producing something genuinely useful. The longer stages aren't a barrier to entry - they're the difference between making a chart and building a report an organisation can rely on. The job-ready stage, roughly, is the standard Microsoft's PL-300 certification is built to test.
Want to skip the slow middle? The stretch between "confident basics" and "job-ready" is where self-teaching drags. Our two-day, live-online Power BI Masterclass is built to compress exactly that stretch - modelling and DAX taught in the right order. Get in touch and we'll tell you whether it fits where you're starting from.
6. What makes your learning curve steeper or gentler
"Is Power BI hard to learn" doesn't have one answer, because it isn't equally hard for everyone. The same tool can feel gentle to one person and steep to another, and the difference comes down to a handful of factors. Knowing where you sit on each one tells you what your own curve is likely to look like.

| Factor | Gentler curve | Steeper curve |
|---|---|---|
| Your starting point | Comfortable with Excel tables and PivotTables | New to spreadsheets and working with data |
| Your data | Clean, well-structured source data | Messy data spread across several systems |
| Your goal | Everyday reports and dashboards | Complex models, advanced DAX, optimisation |
| How you learn | A structured course or learning path | Piecing it together from scattered tutorials |
| Time you can give it | A regular, protected slot each week | Occasional, interrupted sessions |
One factor deserves a caveat: your Excel background. It genuinely helps - the interface, the charts and Power Query will all feel familiar, and that's a real head start. But, as section 3 explained, deep Excel habits can also slow you down, because cell-by-cell thinking is the wrong model for Power BI. So count Excel experience as a gentler start, with one habit to consciously unlearn. For the fuller picture of how the two tools differ, see our Power BI vs Excel guide.
Your starting point makes the biggest single difference, and it's possible to put rough numbers on it. Training providers' estimates for reaching the basics tend to land around four to six weeks for a complete beginner, two to four weeks for someone who already works with data, and one to two weeks for an experienced data professional. The gap is real - though notice that even the slowest of those is measured in weeks, not months.
If most of your answers sit in the left column, expect a comfortable run. If several sit on the right, that doesn't mean Power BI is the wrong choice - it means going in with realistic expectations, and giving the steeper factors, especially how you learn and how much time you protect, a bit more thought.
7. Self-teaching vs structured training
Once you've decided to learn Power BI, the next question is how. Broadly there are two routes, and both work - they just cost you different things.
Self-teaching. Microsoft Learn offers free, official, genuinely good learning paths - structured modules that build on each other, including a beginner-friendly "Dashboard in a Day" workshop - and there's a deep well of YouTube tutorials, books and community help behind them. For the basics, this route is hard to fault: it's free, it fits around your schedule, and plenty of capable Power BI users learned exactly this way.
Its weakness is the middle of the curve. When you don't yet know what good looks like, it's easy to absorb bad habits - the flat-table model, calculated columns where measures belong, DAX that works by accident - and a tutorial can't tell you that you've misunderstood. Self-teaching also leaves you to sequence your own learning, and a common mistake is diving into DAX before the data model underneath it makes sense.
Structured training. A good course - whether that's a multi-day class, a structured online programme, or preparing for the PL-300 certification - does three things self-teaching struggles to. It sequences the material so concepts arrive in a sensible order. It puts a trainer in front of you who catches a mistake before it becomes a habit. And it compresses the slow middle, because someone has already worked out which 20% of the detail you actually need first. What a course mainly buys is time, and the avoidance of unlearning later.
Neither route is the "right" one in the abstract. If you have time, patience and a tolerance for occasional dead ends, self-teaching genuinely works. If your time is short, or you're learning Power BI for a role and want to be dependable sooner, structured training pays for itself in weeks saved. Many people sensibly do both: self-teach the basics, then take a course to get cleanly through the harder stretch. Our Power BI training buyer's guide walks through the options and what UK courses cost.
Weighing up a course? Our Power BI Masterclass is built around the part of the curve that's hardest to self-teach - modelling and DAX, taught in the right order on real examples. Tell us your starting point and we'll give you a straight view on whether a course is worth it for you.
8. Is Power BI worth learning? The UK career case
Difficulty only matters next to the payoff, so it's worth asking whether the effort is repaid. For most people working with data in the UK, it is.
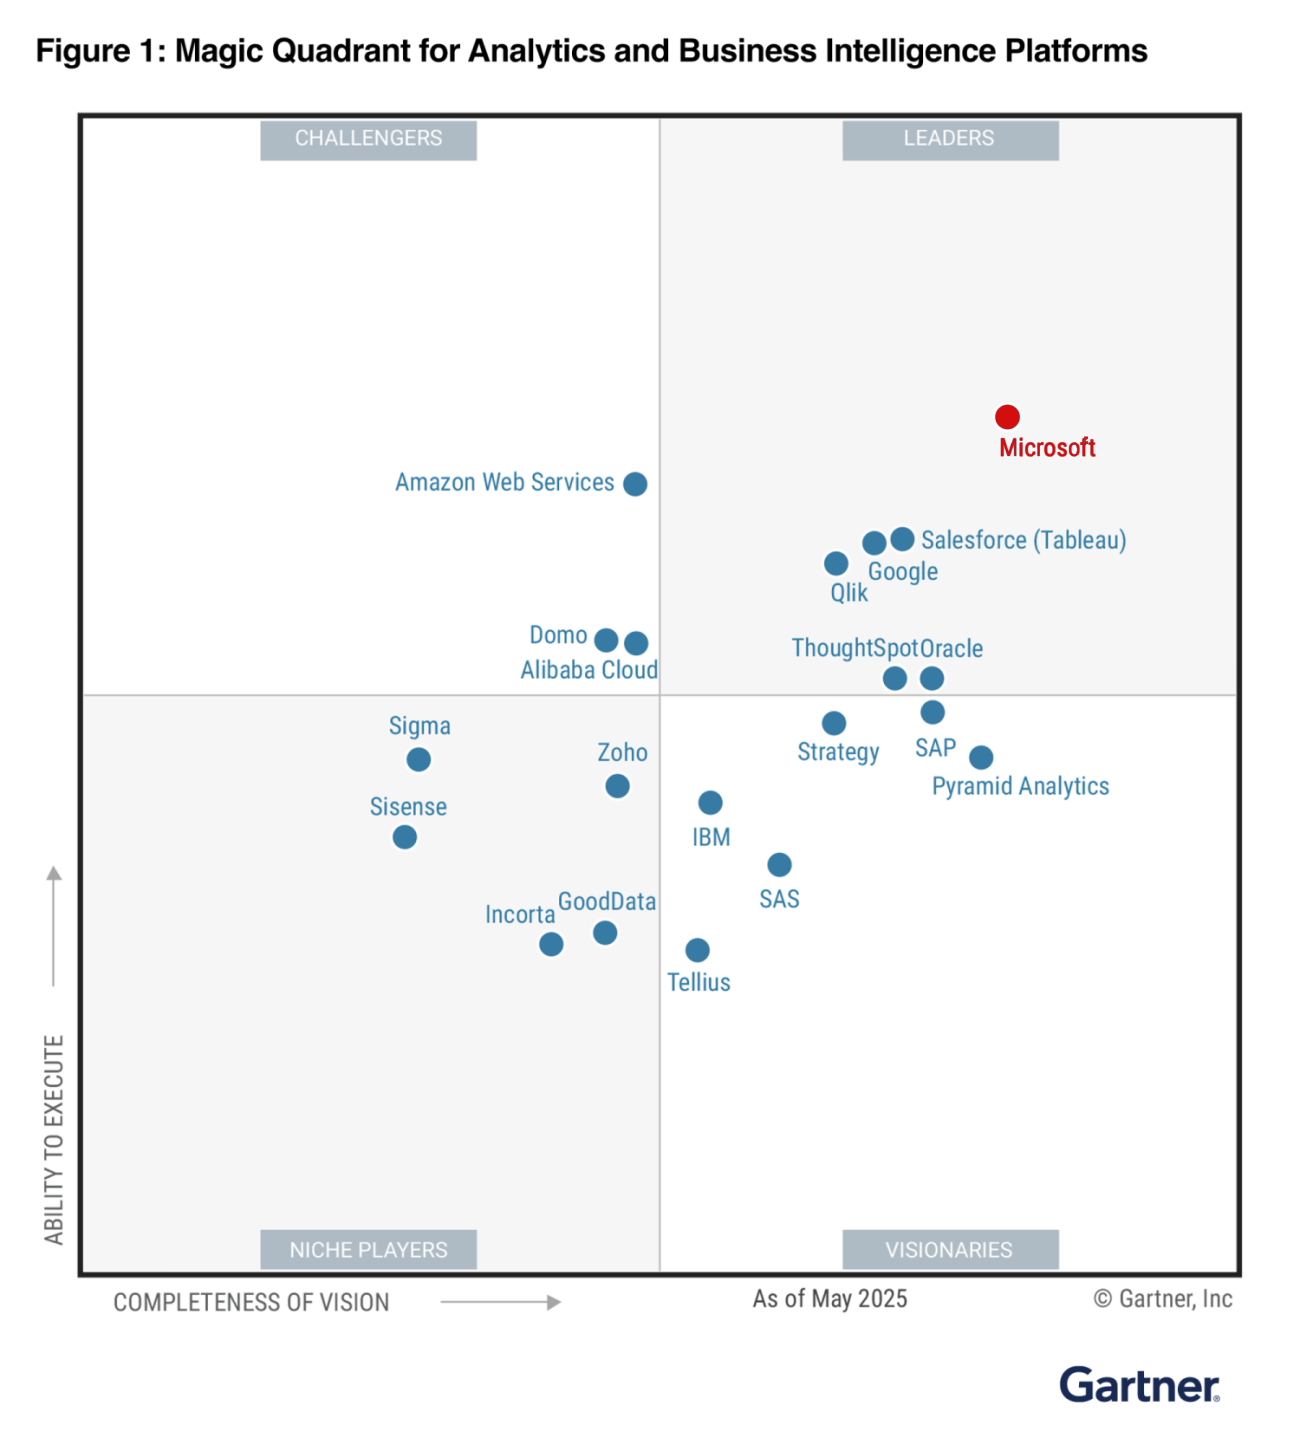
Power BI is one of the most widely used business intelligence tools - a Leader in Gartner's 2025 Magic Quadrant for analytics and BI platforms, and used by hundreds of thousands of organisations.
UK demand is solid and, after a dip in 2025, climbing again: ITJobsWatch recorded around 2,950 permanent UK roles citing Power BI in the six months to 17 May 2026, well up on a year earlier, at a median advertised salary of £55k. Advertised pay runs a wide range, from roughly £35k at the lower end to £90k at the upper, so the skill rewards you across the experience ladder rather than only at the top.
It also reaches well beyond jobs with "analyst" in the title. On the advert data, finance and operations are the single biggest home for Power BI skills, and there's a genuine data-skills shortage behind that demand - the government estimates well over 100,000 data-related roles need filling across UK firms, with most medium and large employers that try to hire data staff reporting difficulty.
Power BI is also a portable skill: learn it once and it travels with you across roles, teams and employers, because so many UK organisations have standardised on the Microsoft stack. For someone weighing whether the learning curve is worth climbing, the cost-benefit is favourable - a few months of focused effort buys a capability that's in demand, reasonably paid and useful well beyond a single job.
It's worth being clear-eyed too. Learning Power BI won't, by itself, transform a career, and the basics alone won't set you apart - enough people can build a simple dashboard now that the bar has risen. The value sits a little further up the curve, around the job-ready stage in section 5: someone who can model data soundly and write dependable DAX is genuinely useful, and that's a realistic target within months, not years.
The arrival of Copilot and AI features in Power BI sharpens that point rather than undoing it: they can draft a measure or assemble a routine dashboard, so the mechanical skills get less scarce while the judgement - sound models, trustworthy numbers, knowing when the AI is wrong - becomes more valuable, not less.
9. How to make learning Power BI easier
Whichever route you take, a few choices make the difference between a learning curve that feels steep and one that feels steady. None is complicated, and together they remove most of the avoidable difficulty.

Learn it in the right order. The sequence that works is data preparation with Power Query first, then data modelling, then DAX, then visuals. It's tempting to start with DAX because it feels like the "real" skill, but DAX makes far more sense once there's a sound model beneath it - and that's a technical fact, not just a teaching preference. DAX calculations flow through the relationships in your model, so a shaky model quietly produces measures that are wrong, in ways that are hard to debug. Learning out of order is one of the most common reasons people find Power BI harder than it needs to be.
Practise on real data. Sample datasets are tidy in a way real data never is. Pick a question you actually care about - your own team's numbers, a dataset from your industry - and the learning sticks, because you're solving a problem rather than following a recipe.
Build the model habit early. Resist the urge to dump everything into one flat table. Getting comfortable with a simple star schema from the start prevents the single biggest source of later pain, and it makes DAX easier when you get there.
Don't try to learn all of it. Power BI is large, and you don't need all of it. Aim for the core workflow - prepare, model, calculate, visualise, publish - and let the advanced corners wait until a real task calls for them.
Get feedback. The fastest way to fix a misunderstanding is for someone who knows Power BI to look at your work. A course, a colleague or an active community thread all do the job; the point is not to learn in a vacuum, because a vacuum is where bad habits set hard.
Decided Power BI is worth learning? Our two-day, live-online Power BI Masterclass teaches the prepare, model, visualise and publish workflow in the right order, with no prior Power BI experience needed - so you skip the bad habits and the slow detours. See the Power BI training buyer's guide for how it compares, or get in touch with where you're starting from.
10. Frequently asked questions
11. Sources
- Microsoft Learn - What is Power BI? and Power BI Desktop getting started (learn.microsoft.com)
- Microsoft Learn - DAX overview and evaluation context (learn.microsoft.com)
- Microsoft Learn - understand star schema and the importance for Power BI (learn.microsoft.com)
- Microsoft Learn - the Power Query M formula language (learn.microsoft.com)
- Microsoft Learn - PL-300 Power BI Data Analyst certification and learning paths (learn.microsoft.com)
- SQLBI - DAX evaluation context, CALCULATE and context transition (sqlbi.com)
- Coursera - how long it takes to learn Power BI (coursera.org)
- ITJobsWatch - Power BI UK job vacancies and median salary, six months to 17 May 2026 (itjobswatch.co.uk)
- Gartner - 2025 Magic Quadrant for Analytics and Business Intelligence Platforms (gartner.com)
- GOV.UK - data skills in the UK economy and the data-skills gap (gov.uk)